Trump, Xi and the AI race: who is really ahead
After the Washington summit, twelve indicators to understand a rivalry in which each side wins on the ground the other leaves uncovered
by Piero Boccardo
At the end of September Xi Jinping was received at the White House for a three-day summit with Donald Trump. On artificial intelligence, the outcome was modest in form and revealing in substance: a communication channel for AI-related incidents, a first round of dialogue scheduled for November and, at American insistence, the adoption in White House documents of the term “super intelligence” in place of “artificial intelligence”. Beijing let it be known that it “respects” the choice, without adopting it. A few hours later Trump made the point of the exercise clear: the United States will not put on the brakes, because it is ahead “by at least a year, maybe a year and a half”, and when you are in front you “don’t open up” the game to your opponent. Xi, for his part, insisted that AI “must remain under human control”.
Two narratives, then: one of a race that America is winning, and one of a technology to be governed together. To understand which of the two holds up, it is worth setting the statements aside and looking at the numbers. Twelve indicators were compared, drawn largely from the Stanford AI Index 2026, Epoch AI, the International Energy Agency and Ember, and for each one the ratio between the US value and the Chinese value was calculated. The result is not a ranking but a map: each of the two powers dominates where the other is weak, and almost never on the same ground.
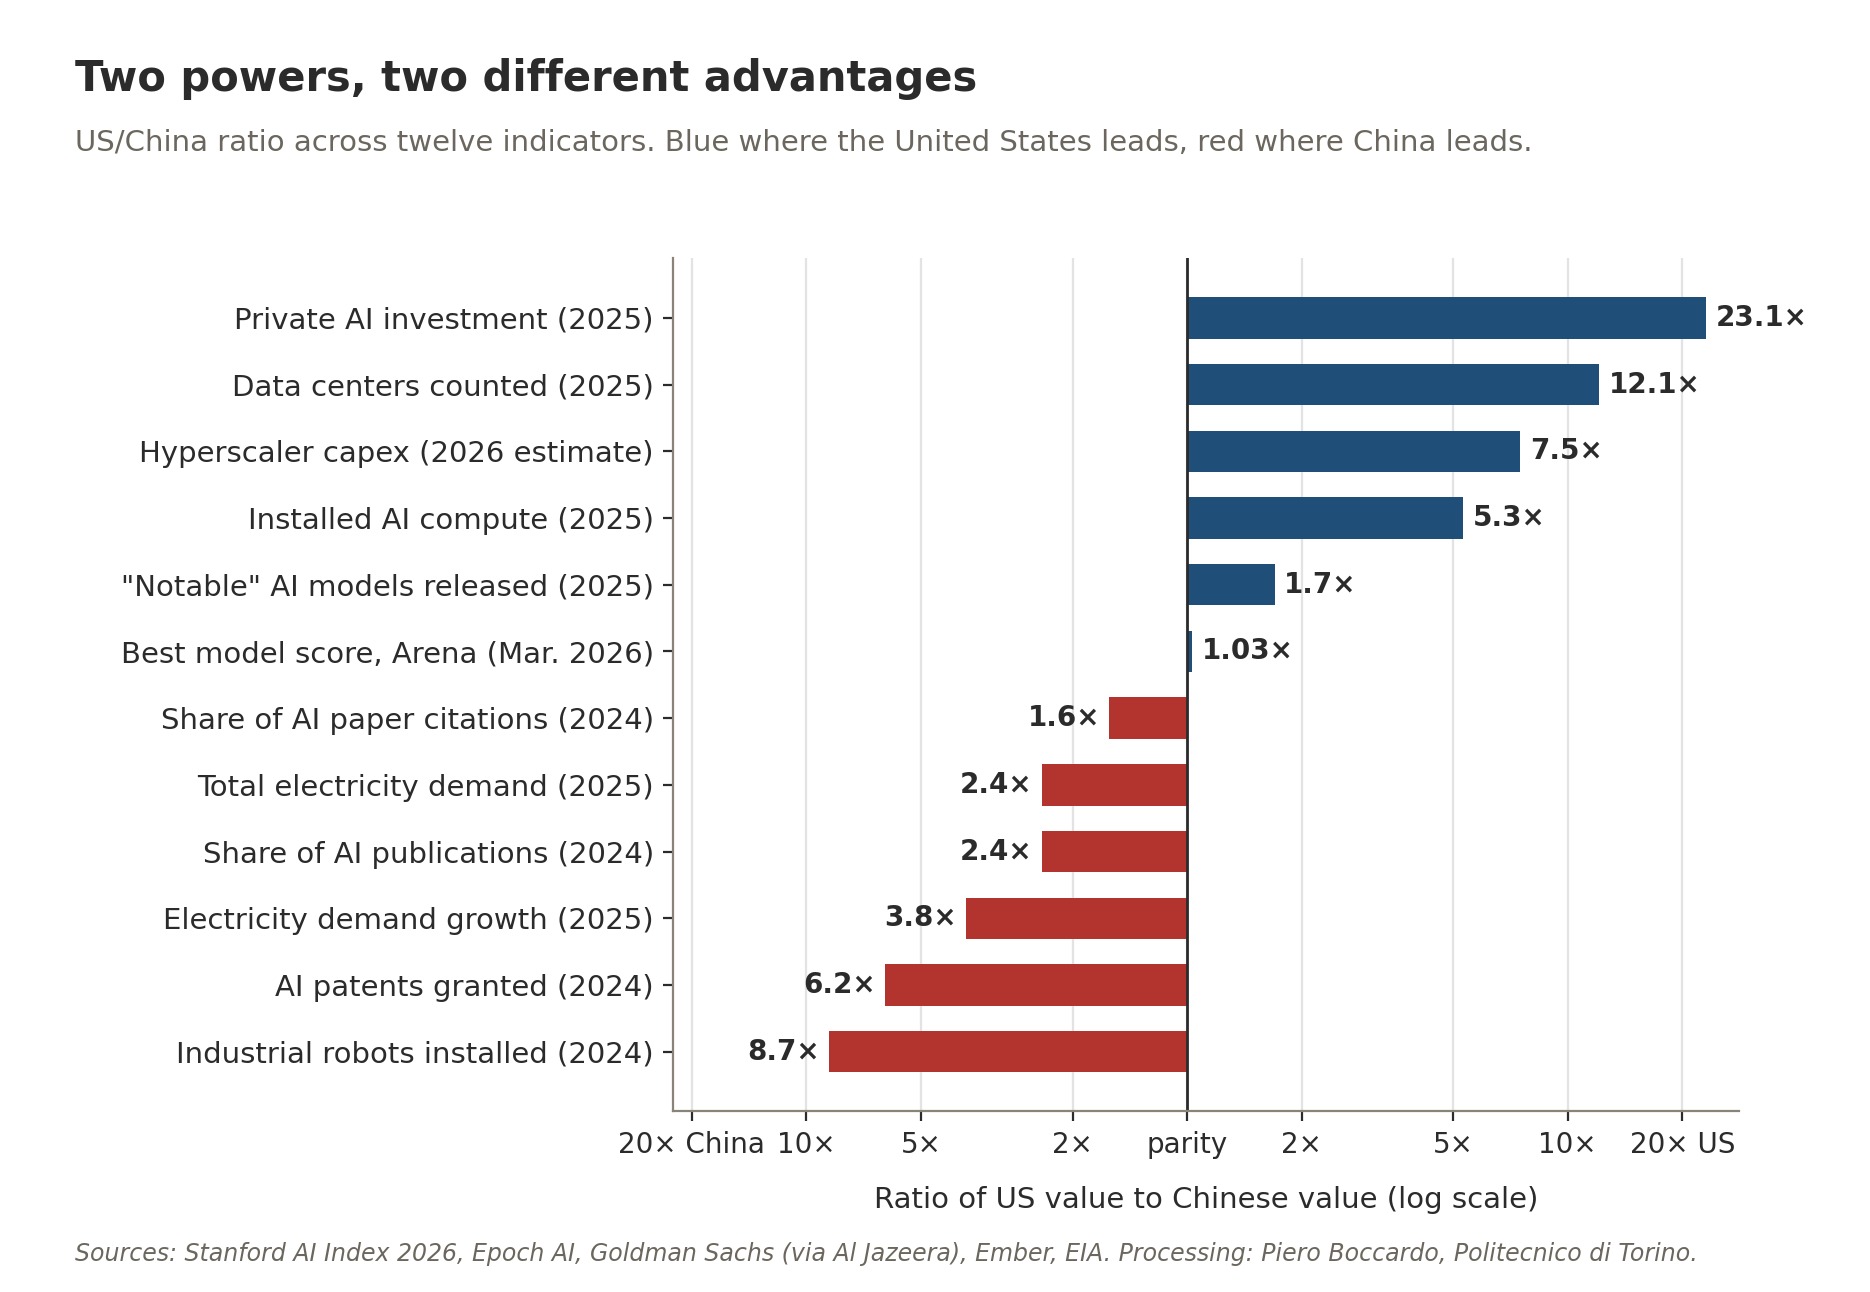 Figure 1. Ratio of the US value to the Chinese value for twelve indicators, on a logarithmic scale: blue bars indicate a US advantage, red bars a Chinese advantage. Sources: Stanford AI Index 2026, Epoch AI, Goldman Sachs, Ember, EIA; author’s processing.
American dominance: capital, compute, infrastructure
The most conspicuous US advantage is financial. In 2025 private investment in artificial intelligence reached 285.9 billion dollars in the United States, 23 times China’s 12.4 billion, with growth of 160% in a single year against 32% in China. The gap widens further when one looks at the capital spending of the major cloud operators: according to Goldman Sachs estimates, Amazon, Microsoft, Google, Meta and Oracle will spend about 764 billion dollars in 2026, against 102 billion for Alibaba, Tencent, Baidu and ByteDance. It should be said that comparing private capital alone penalizes China, where a significant share of investment flows through public guidance funds: according to estimates cited by the AI Index, between 2000 and 2023 these vehicles channelled about 184 billion dollars to AI companies. It is a substantial figure, but spread over more than twenty years it does not close a gap that is now measured in hundreds of billions per year.
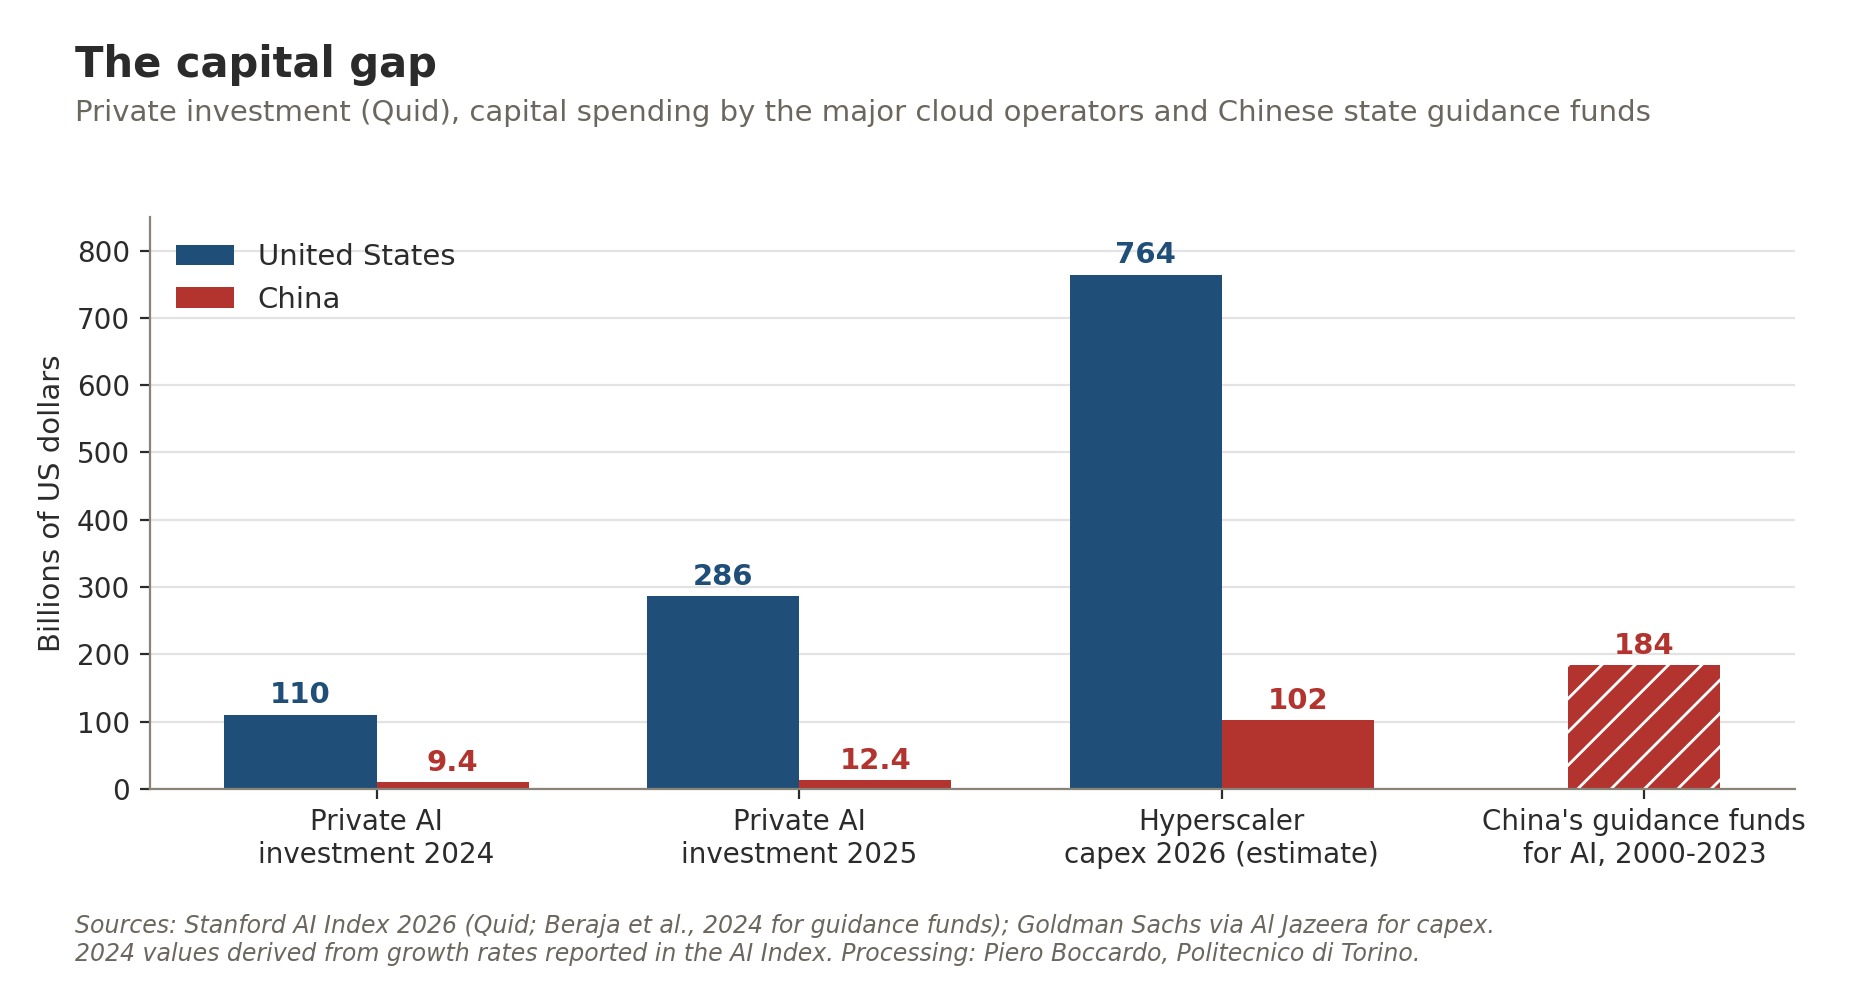 Figure 2. Private investment in AI in 2024 and 2025, estimated capital spending of the main cloud operators in 2026 and Chinese public guidance funds directed to AI between 2000 and 2023, in billions of dollars. Sources: Stanford AI Index 2026 (Quid data), Goldman Sachs; author’s processing.
This capital turns into machines. According to the census of GPU clusters (groups of networked computers that pool their computing power) maintained by Epoch AI, the United States hosts 74.5% of the AI computing capacity documented worldwide, China 14.1%, and all other countries combined just over 11%. In 2025 the United States counted 5,427 data centers, more than ten times any other country; China reported 449, although the number alone says little, because Chinese facilities tend to be larger and less well documented. Upstream of everything lies silicon: Nvidia alone supplies more than 60% of the computing capacity installed worldwide, while Huawei holds a small, though growing, share.
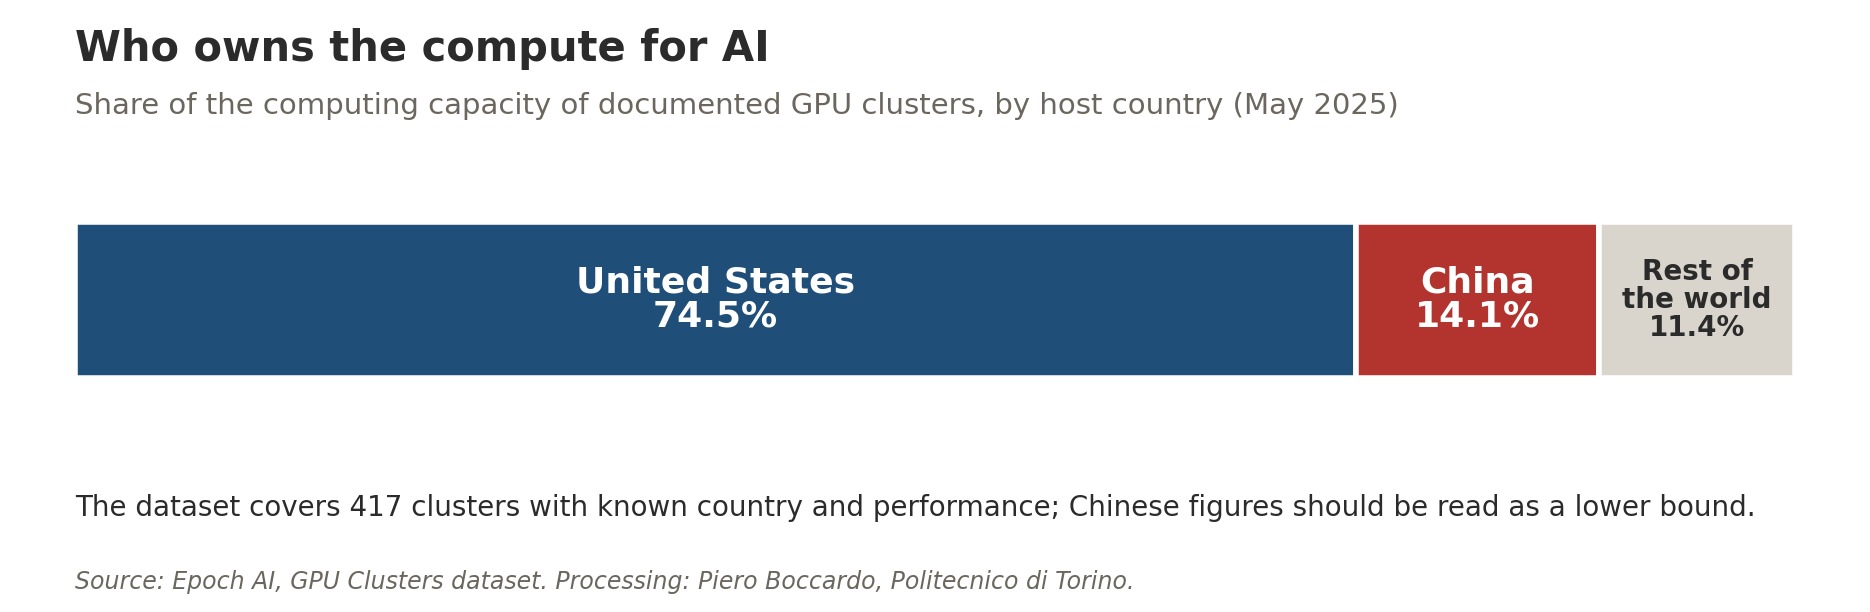 Figure 3. Breakdown of the computing capacity of documented GPU clusters by host country, May 2025. Source: Epoch AI; author’s processing.
The geography of data centers, however, tells of two different models. In the United States the distribution follows the market: according to the Data Center Map census, Virginia alone hosts 674 facilities, almost one in seven, gathered largely around Ashburn, the largest data center hub in the world; it is followed by Texas (537), California (296), Georgia (276), Illinois and Ohio, with the South and the Midwest growing thanks to cheaper land and electricity. In China the same source counts 376 facilities, almost all along the coast: Hebei (62, driven by the Langfang hub on the outskirts of Beijing), Guangdong (60), Shanghai (57) and Beijing (49). The Chinese figure is certainly incomplete, but the shape of the distribution is telling, and it is precisely this concentration in the east, where users and businesses are located but energy costs more, that the national “Eastern Data, Western Computing” plan, launched in 2022, seeks to correct. Eight hubs and ten clusters, four of them in sparsely populated inland regions (Inner Mongolia, Ningxia, Gansu, Guizhou) where coal, wind and sun are abundant: this is the cartographic translation of the energy advantage discussed further on.
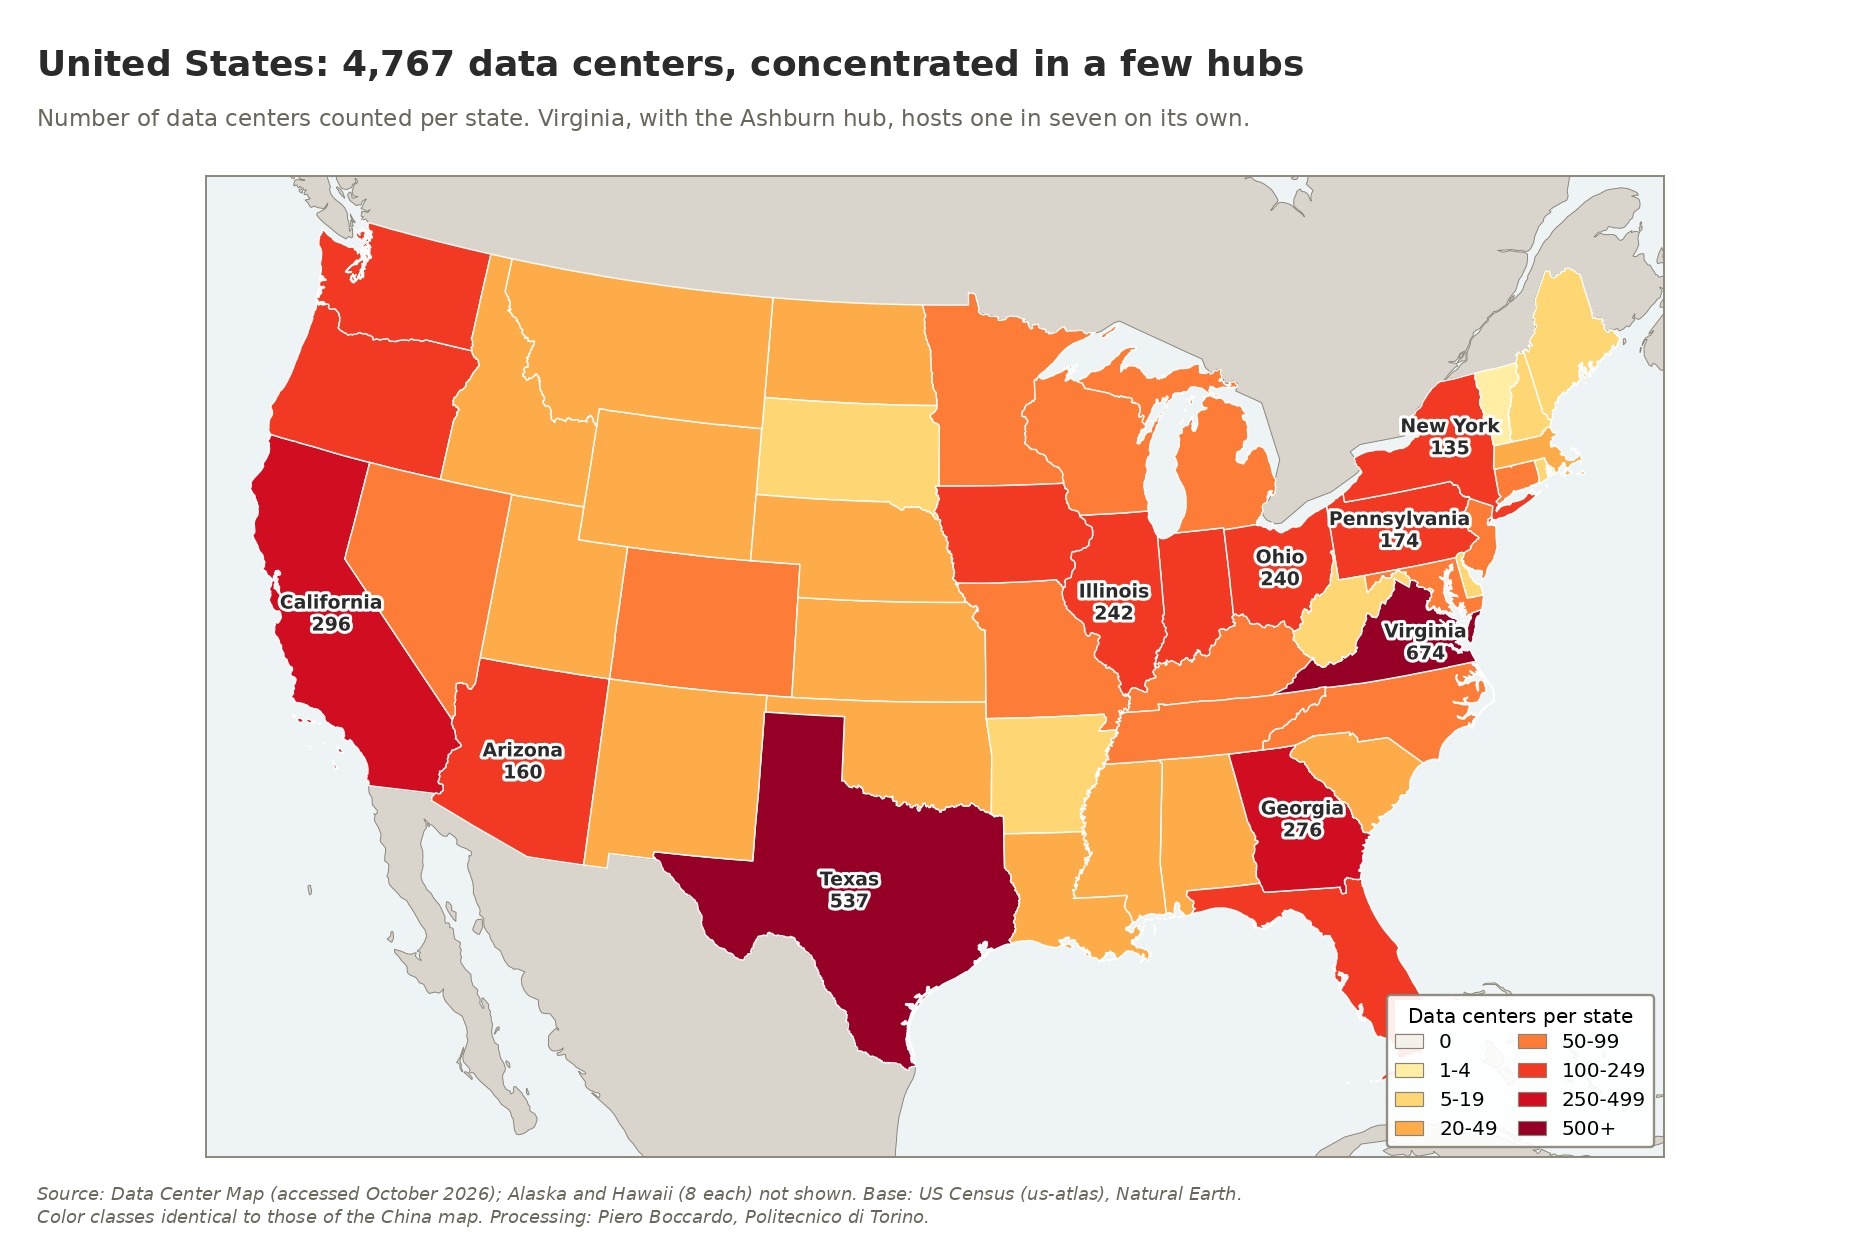 Figure 4. Number of data centers counted per state in the contiguous United States; Alaska and Hawaii, with 8 facilities each, are not shown. Source: Data Center Map (October 2026); author’s processing.
That American concentration has almost accidental roots. In 1992 MAE-East, the first non-governmental internet exchange point in the United States, was born in Tysons Corner, Virginia; by the late 1990s about half of the world’s internet traffic passed through it, and in 1998 it moved to Loudoun County. From then on the logic of networks took over: it pays to set up where the most interconnected operators already are, and each new arrival makes the hub even more attractive. In the same way the other major hubs, from New York to Chicago, from Dallas to Silicon Valley, grew next to the users and businesses that demand minimal response times. Today, however, the limiting factor is no longer land but electricity. In Virginia, pending connection requests with Dominion Energy exceed 40 GW; Loudoun County went from 1 to 3.4 GW of consumption between 2018 and 2023 and since 2025 no longer allows new data centers to be built without a specific permit. Growth is therefore shifting to neighbouring counties and towards Texas, the South and the Midwest, where land and energy cost less: the market, in other words, is chasing electricity.
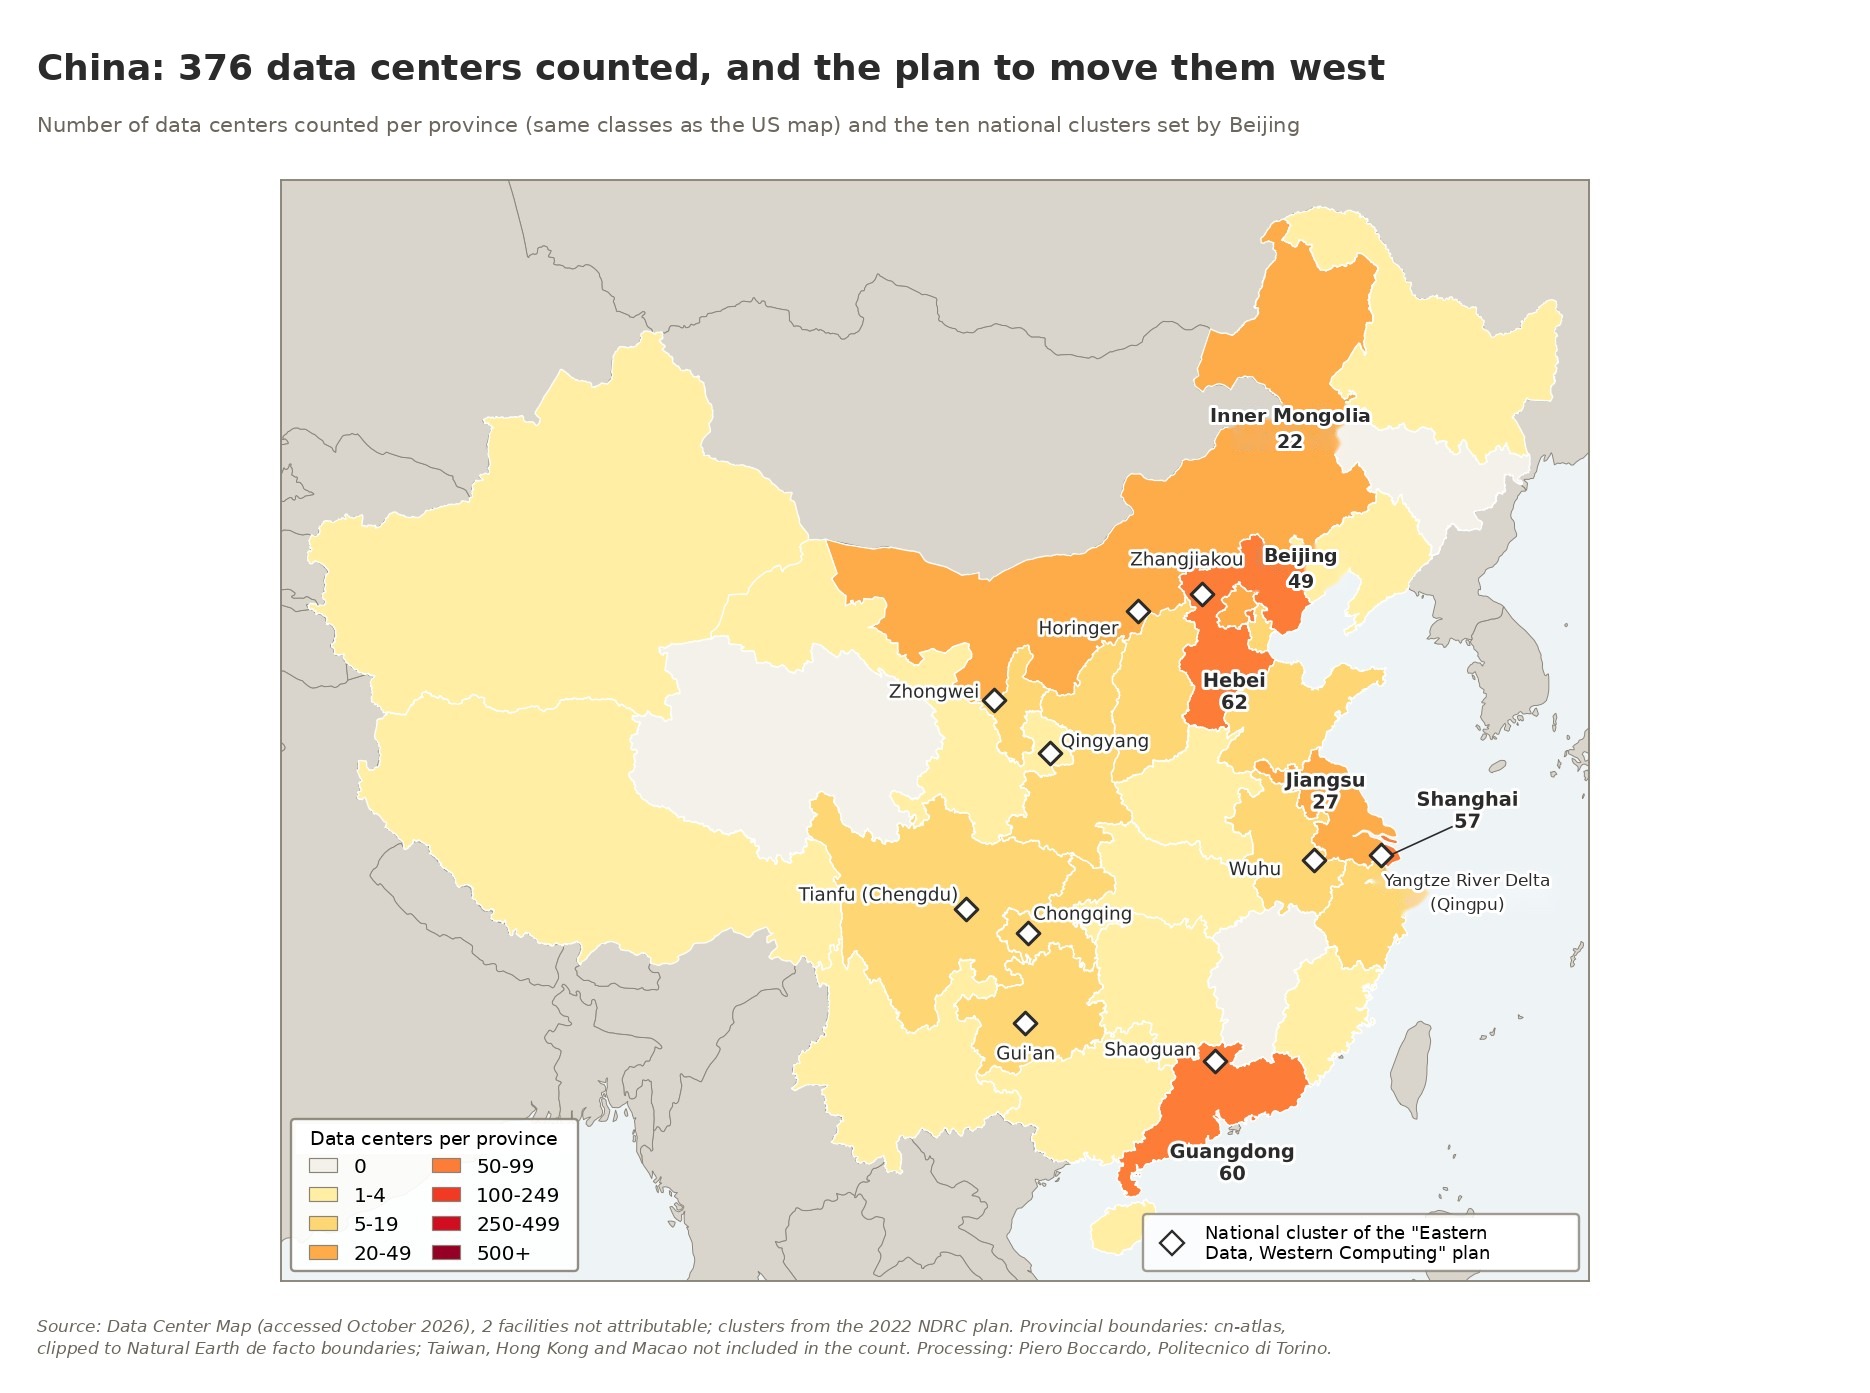 Figure 5. Number of data centers counted per province in China, with the same color classes as Figure 4, and the ten national clusters of the “Eastern Data, Western Computing” plan. Sources: Data Center Map (October 2026), National Development and Reform Commission; author’s processing.
The Chinese logic is the opposite, and it bears the signature of the State. Users, businesses and therefore data centers cluster on the coast, where electricity is scarcer and more expensive; the interior, by contrast, has abundant coal, wind and sun and a cool, dry climate that allows server rooms to be cooled largely with outside air, cutting consumption considerably. The “Eastern Data, Western Computing” plan was designed to exploit this asymmetry: move computation to where energy is cheaper, curb emissions, ease the pressure on eastern power grids and, not least, bring investment to the poorer provinces. The price to pay is distance, because every extra kilometre between servers and users lengthens response times. This is why the west mainly receives workloads that can wait, such as model training, batch processing and backups, while whatever needs immediate responses stays close to the coastal cities. There is no shortage of sceptics: some observe that what is really moving is energy rather than data, in the wake of the old west-to-east power transmission programme, and others fear capacity built more for political targets than for real demand. Either way the contrast with the United States is stark: there, data centers are born where the customers are and then go looking for energy; here, they are taken to where the energy is, accepting to be a little further from the customers.
The chip paradox
This is where diplomacy meets technology. Since 2022 Washington has used export controls on advanced semiconductors as its main lever to slow Beijing down. In January 2026, however, the Trump administration opened the door to case-by-case licences for H200-class chips, with a 25% levy on sales. The move, which critics compared to selling uranium to the Kremlin during the Cold War, ran into an unexpected obstacle: China itself. Chinese authorities first blocked imports at customs, then urged companies to favour domestic chips, reserving American processors for model training. In July a Commerce Department official described actual shipments as “negligible”, against licences approved for about 10 billion dollars.
The paradox is plain. The United States decided to sell just when China decided not to buy, because for Beijing self-sufficiency in semiconductors is worth more than a few quarters of computing advantage. The price of this choice, however, is high. According to an analysis by the Council on Foreign Relations, even under the most optimistic production assumptions the computing capacity supplied by Huawei in 2026 will be about 4% of Nvidia’s. The bottleneck is not chip design but manufacturing: without ASML’s extreme ultraviolet lithography machines, SMIC, China’s largest semiconductor foundry, struggles to produce in volume and with acceptable yields. It is no coincidence that the dependence of the entire global supply chain on a single foundry, TSMC in Taiwan, is one of the invisible threads tying the technology dossier to the Taiwan question, which remained on the margins of the summit’s official statements.
Models: a technical tie with far fewer resources
If compute tilts clearly towards Washington, model performance tells another story. On Arena, the platform where users compare the answers of two models blind and vote for the better one, the lead of the best US model over the best Chinese model was 9.26% in January 2024. In February 2025 DeepSeek-R1 practically reached the top, trailing by just 0.4%. In March 2026 the leading American model, Anthropic’s Claude Opus 4.6, was ahead of ByteDance’s Dola-Seed-2.0 by 39 points, or 2.7%. The Stanford AI Index explicitly speaks of a gap that has “effectively closed”.
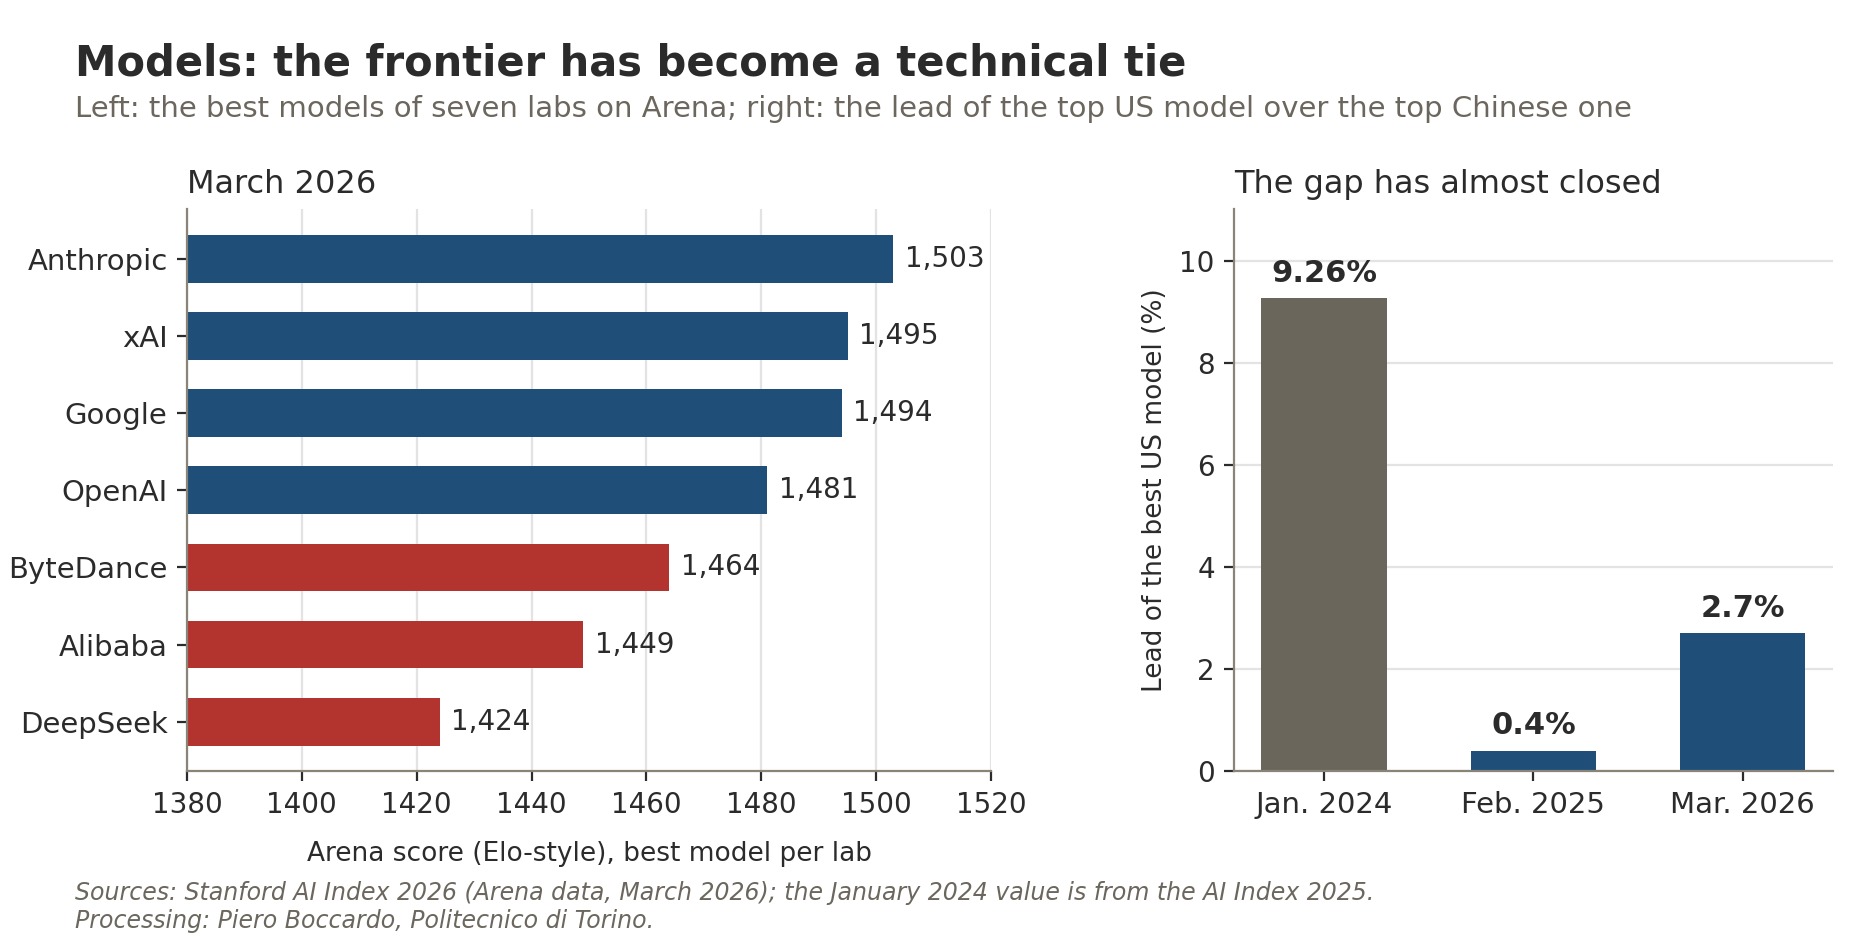 Figure 6. Left, Arena score of the best model of seven labs in March 2026; right, percentage lead of the best US model over the best Chinese model. Sources: Stanford AI Index 2026 and 2025, Arena data; author’s processing.
Other measures are less generous to China: in May the US government’s Center for AI Standards and Innovation estimated that DeepSeek V4 Pro was about eight months behind the best American models, a lag that is in any case shorter than the “year, maybe a year and a half” claimed by Trump. But even taking the harshest estimates at face value, a remarkable fact remains: China obtains competitive models with one twenty-third of the private investment and less than a fifth of the computing capacity. And it distributes them differently. Many Chinese models are “open weight”, meaning anyone can download and modify them, and they cost less: on OpenRouter, a platform that measures developers’ actual use of models, the top three places by volume of tokens processed are held by DeepSeek, Z.ai and Tencent. The United States still produces more frontier models, 59 “notable” models in 2025 against 35, but China is winning the diffusion game.
Research and talent: China produces, America attracts (less and less)
On scientific output the picture is reversed. In 2024 China authored 17.8% of the world’s AI publications against 7.3% for the United States, and collected 20.6% of citations against 12.6%. On patents the gap is overwhelming: 74.2% of AI patents granted worldwide in 2024 were Chinese and 12.1% American, the latter share in steady decline from its 2015 peak of 42.8%. The AI Index notes that American patents remain more highly cited, a sign of higher average quality, but the long-term trend is unmistakable.
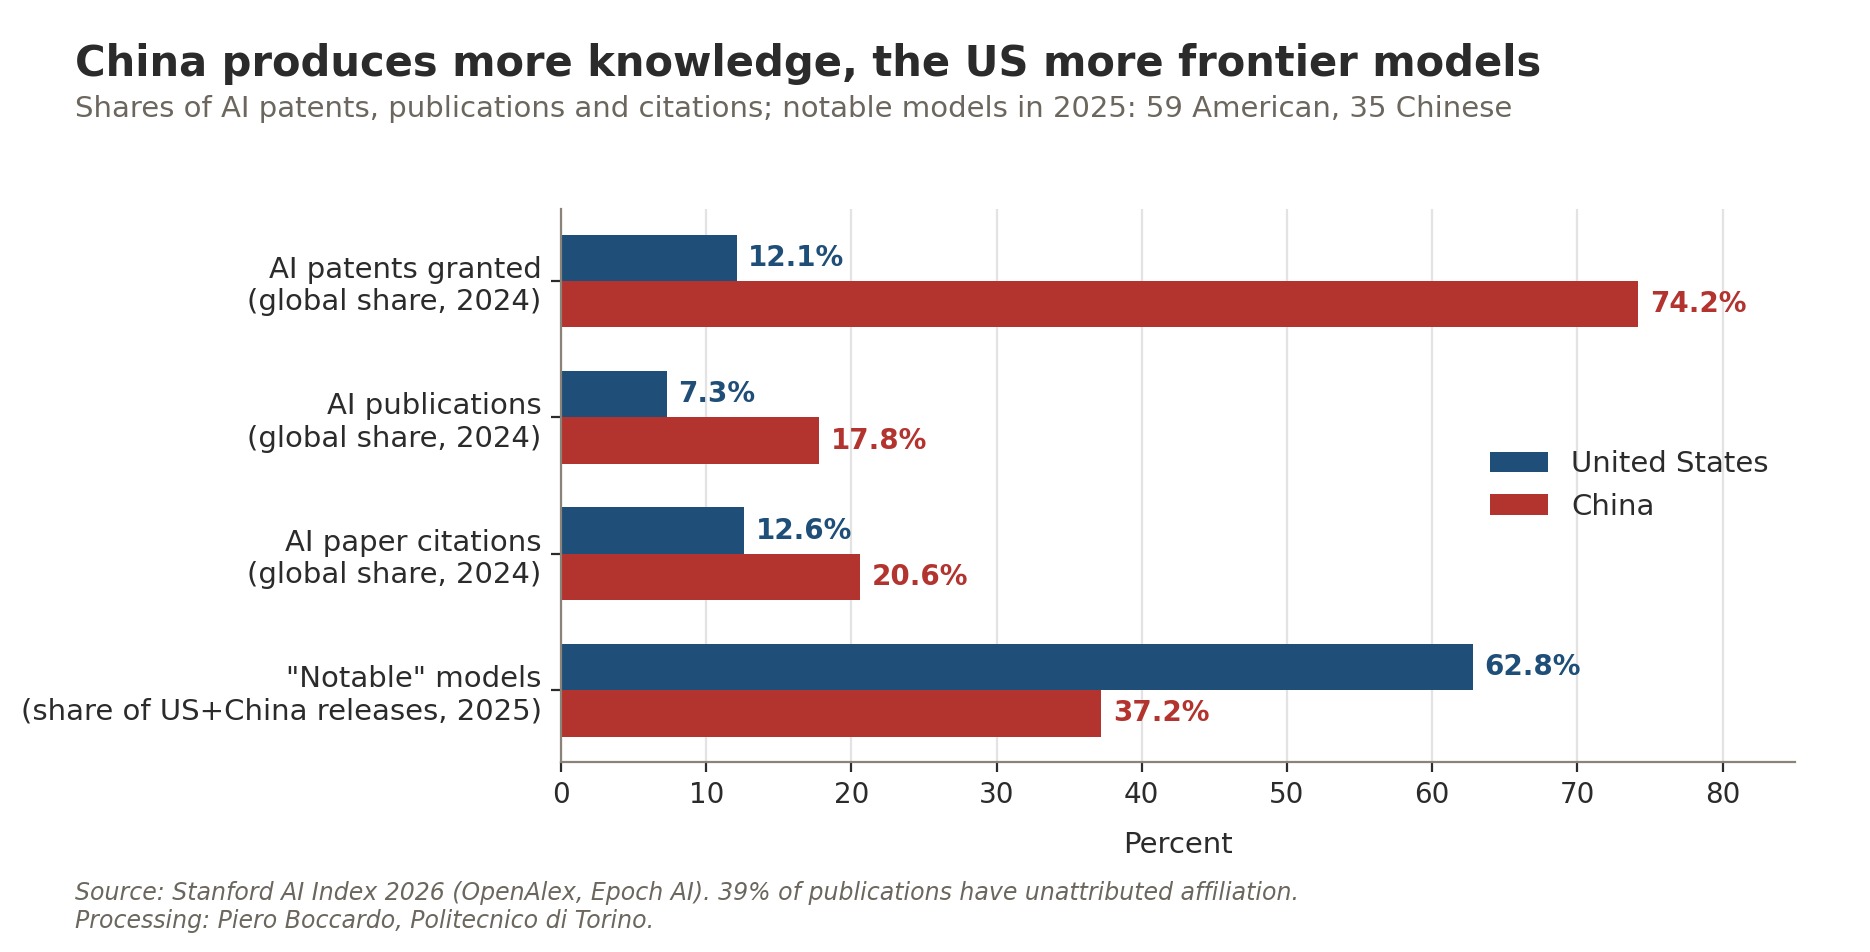 Figure 7. Global shares of AI patents, publications and citations (2024) and breakdown of notable models released by the United States and China in 2025. Source: Stanford AI Index 2026; author’s processing.
Then there is perhaps the most surprising figure in the entire Stanford report: the number of AI researchers and developers moving to the United States has fallen by 89% since 2017, and by 80% in the last year alone. The United States remains the country with the largest pool of talent in the field, but it is attracting new talent at the slowest pace in over a decade. For a system that for decades built its supremacy partly on its ability to absorb the world’s best minds, many of them trained in Chinese universities, this is a signal that weighs more than any benchmark.
Energy, the advantage that cannot be imported
The ground on which China enjoys its most solid advantage is also the least discussed: electricity. In 2025 Chinese electricity demand reached 10,573 TWh, a third of the world total, against US generation of 4,430 TWh. Even more significant is the pace: in a single year China added 503 TWh of demand, almost four times the 131 TWh added by the United States, and covered all of it with new output from clean sources, while in the United States coal generation grew again (plus 85 TWh) because of higher gas prices.
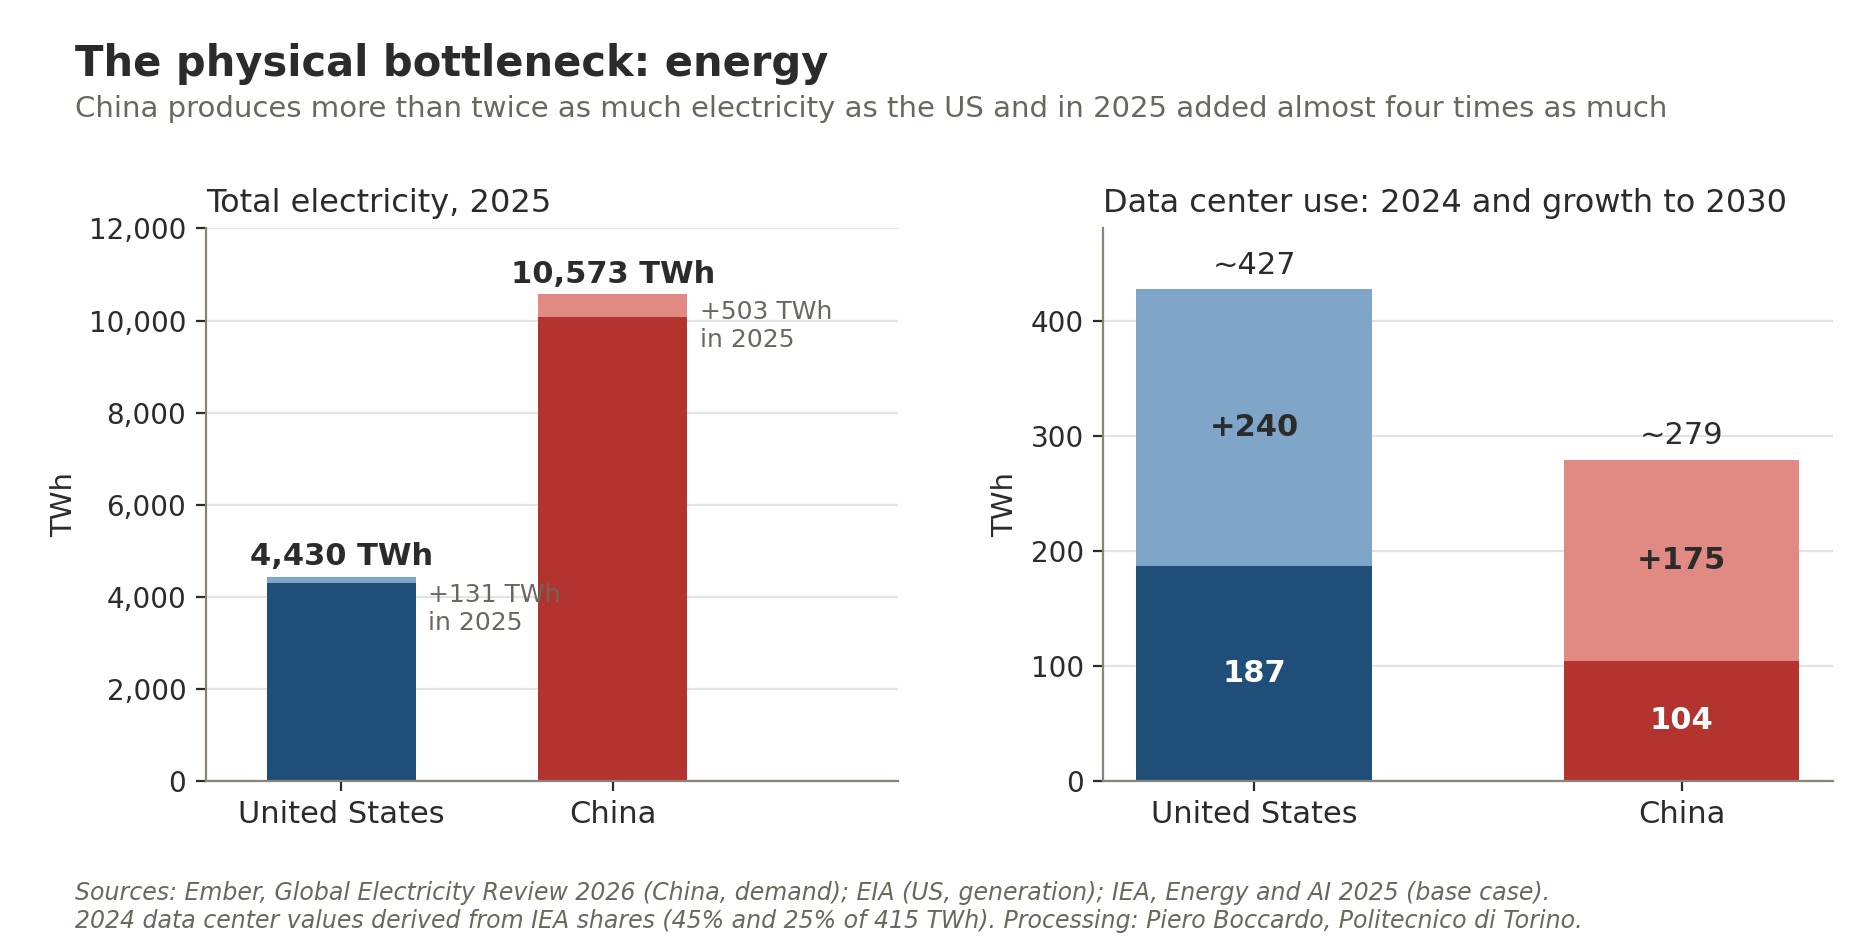 Figure 8. Left, total electricity in 2025 and the increase over 2024; right, data center electricity consumption in 2024 and projected growth to 2030 in the IEA base case. Sources: Ember, EIA, IEA; author’s processing.
According to the IEA, in 2024 US data centers consumed about 45% of the world’s electricity used for this purpose and Chinese ones 25%; by 2030 the former will add about 240 TWh and the latter 175, and together they will account for almost 80% of global growth. In the United States data centers will explain almost half of the increase in national electricity demand. For Washington, energy is therefore the constraint that could slow the race: grid connection queues and permitting times are measured in years. For Beijing it is the resource that can partly offset the lag in chips, because less efficient computing capacity can be sustained if electricity is abundant and cheap. Chips and kilowatt-hours are, in the end, two sides of the same problem.
Two strategies, two ideas of power
Putting the pieces together, a picture emerges that escapes the metaphor of a two-horse race with a single finishing line. The United States is betting on the frontier: more capital, more compute, ever more powerful models, in the belief that whoever first reaches systems of superior capability will secure a decisive advantage. The lexical choice of “super intelligence” imposed at the summit is not merely a presidential quirk: it signals that Washington thinks in terms of a finishing line to be reached before anyone else. China, by contrast, seems to be playing a different game. With 295,000 industrial robots installed in 2024 against 34,000 in the United States, with open and inexpensive models and with a power system growing faster than any other, Beijing is betting on the diffusion of AI across the real economy more than on primacy in the lab.
A key to interpretation comes from international relations scholarship. Looking at past industrial revolutions, what shifted the balance of power was not so much who invented first as who managed to carry new technologies through the whole economy, training enough technicians and engineers to adopt them everywhere (Ding, 2024). This is the direction Beijing seems to have taken, with a strategy some have called “diffusion-forward”, running through manufacturing, robotics and the weight of the investor State (Chen et al., 2026). Seen this way, the image of an arms race, so dear to public debate, risks being misleading: what is under way looks more like an innovation race, in which security, economics and prestige intertwine, than a zero-sum contest (Schmid et al., 2025).
The asymmetries of diplomacy also become easier to understand. Whoever feels ahead at the frontier has little appetite for shared constraints, and Trump said so bluntly. Whoever bets on diffusion, on the other hand, has every interest in writing the rules of the game, so that its own technology becomes the standard, especially in emerging countries. The World AI Cooperation Organization, launched in Shanghai in July at Beijing’s initiative with twenty-nine founding countries, mostly Asian, African and Latin American, should be read in this light. Washington offers the world a technology package, Beijing a governance framework: two different ways of exercising influence, which the September summit set side by side without really trying to reconcile them.
What remains of the summit
The incident channel brings to mind, almost inevitably, the hotline between Washington and Moscow set up in the aftermath of the Cuban missile crisis. The comparison is evocative but only goes so far: in 1963 the talk was of arsenals that could be counted and verified, whereas today knowing what is really happening inside an AI lab is almost impossible, as more than one American analyst points out. A channel of this kind serves to keep an incident from spiralling out of control, not to regulate the competition. Perhaps it was the most that could be achieved: a little predictability in a rivalry that both sides now regard as structural.
And Europe, Italy included? With 20.9 billion dollars of private investment in 2025 it sits closer to China than to the United States, but without China’s energy system and manufacturing base or America’s computing power. And yet, if the game is also played on diffusion and not only at the frontier, the continent does hold some cards: a dense industrial fabric, widespread engineering skills, and a regulatory tradition that is watched with interest elsewhere. Provided it takes the field, instead of following the race from the stands.
A note on methodology
The comparison in Figure 1 is built as the ratio between the US value and the Chinese value for each indicator, plotted on a logarithmic scale so that an advantage by a factor of 2 has the same visual length in both directions. The indicators come from different sources and years (from 2024 to 2026) and should not be added up or averaged: they serve to show where the relative advantages lie, not to declare an overall winner.
Some limitations deserve attention. Private investment data (Quid, via the Stanford AI Index) do not include public funds, which carry considerable weight in China; 2024 values were derived from the growth rates reported in the index. Epoch AI’s share of computing capacity refers to documented clusters with known country and performance (417 out of 728) and covers a fraction of global capacity: for China it should be read as a lower bound. The data center count does not take facility size into account. The January 2024 Arena gap value comes from the 2025 edition of the AI Index and uses a slightly different methodology from the later values, taken from the 2026 edition (historical leaderboard with style control). For energy, Chinese demand (Ember) was compared with US generation (EIA), two very similar but not identical quantities; 2024 data center consumption was derived from IEA shares applied to the global total of 415 TWh. Finally, the 2026 cloud operator capital spending figure is a Goldman Sachs forecast reported by Al Jazeera.
The maps in Figures 4 and 5 are based on Data Center Map counts accessed in October 2026. This directory is oriented mainly towards commercial and colocation facilities, does not account for size or installed power, and for China covers only a limited part of the real stock (the AI Index, using another source, reports 449 facilities). Chinese data are provided by city and were aggregated by province; two facilities could not be attributed, and the sum of individual entries differs by one from the declared total in both countries. Color classes are identical in the two maps, so that intensity can be compared. Provincial boundaries were clipped to Natural Earth de facto boundaries; Taiwan, Hong Kong and Macao are not included in the count.
Sources: Stanford HAI, “The 2026 AI Index Report”, April 2026 (chapters Research and Development, Technical Performance, Economy); Stanford HAI, “The 2025 AI Index Report”; Epoch AI, GPU Clusters dataset and “Trends in AI supercomputers”; International Energy Agency, “Energy and AI”, 2025; Ember, “Global Electricity Review 2026”; U.S. Energy Information Administration, 2025 generation data; Council on Foreign Relations, analysis of Huawei chip production, 2025; CBS News/AP, “Trump and Xi agree to set up AI safety channel”, 26 September 2026; Al Jazeera, “China vs US: Who is winning the AI race, in four charts”, 24 September 2026; The Christian Science Monitor, “On eve of China summit, Trump raises stakes on AI competition”, 21 September 2026; Ding J., “The Rise and Fall of Technological Leadership: General-Purpose Technology Diffusion and Economic Power Transitions”, International Studies Quarterly, 2024; Chen H. et al., “China’s Diffusion-Forward AI Strategy: The ‘AI Race’ in Political Economic Context”, Asian Economic Policy Review, 2026; Schmid S. et al., “Arms Race or Innovation Race? Geopolitical AI Development”, Geopolitics, 2025; Data Center Map, listings by state and by market, accessed October 2026; National Development and Reform Commission, “Eastern Data, Western Computing” plan, 2022; Data Center Frontier, “Dominion Resumes New Connections, But Loudoun Faces Lengthy Power Constraints”; Datacentres.com, analysis of the Northern Virginia market, August 2026; ChinAI, “The East-West Compute Transfer Project”; base maps US Census Bureau (us-atlas), Natural Earth (world-atlas), cn-atlas. Map and statistical processing by Piero Boccardo, Politecnico di Torino.