Fires in Europe: what changes between 2025 and 2026
A comparison between EFFIS satellite maps of burned areas: the 2026 season, updated to mid-August, against the record-breaking 2025 season
by Piero Boccardo
Every colored dot on the two satellite maps below is a burned area detected from space: data from the European EFFIS system (European Forest Fire Information System), the Copernicus Emergency Management Service that has been collecting near-real-time wildfire detections across the continent since the early 2000s, combining MODIS and VIIRS imagery with burned-area estimation algorithms. The comparison is between the entire 2025 season — a record year for wildfires in Europe — and the 2026 season as it stands today, in mid-August, with the hottest part of summer not yet over. Drag the vertical bar to compare the two seasons, use the scroll wheel or the +/- buttons to zoom in down to the single polygon.
Why (almost) always the same places?
Looking at the two maps one after the other, it is immediately clear that wildfires are not randomly distributed: certain bands of the continent (the Tyrrhenian coast and Corsica, inland Andalusia, the Balkan interior, the eastern Carpathians in Romania) show up colored in both years, while most of central and northern Europe remains essentially dark on both maps. To check this beyond a visual impression, we compared the two satellite maps pixel by pixel (at a resolution of roughly 150 km, the same grid EFFIS uses to distribute this data): 52% of the areas that burned in at least one of the two years burned in both; and, even more strikingly, 85% of the areas active in 2026 had already burned in 2025. In practice, almost everything that has burned in 2026 so far was already a known risk area the year before.
The most clearly recurring areas identified through this comparison are: the eastern Carpathians between Romania and Moldova, inland south-central Bulgaria, the interior of the western Balkans (Serbia, Montenegro, Bosnia), the northern Tyrrhenian coast together with Corsica and Sardinia, inland Andalusia in Spain, and western Greece along the border with Albania.
The reason it is more or less always the same places is not a statistical mystery, but the sum of three structural factors that change very slowly from one year to the next, while the intensity of a given season (how bad a given year is) depends on that summer’s specific weather:
- climate: the Mediterranean and sub-Mediterranean belts of the continent structurally have hot, rain-free summers, so vegetation dries out every year in the same period and in the same places, creating a risk window that recurs reliably;
- available fuel: in inland Iberia, the Apennines and the Balkan interior, decades of rural depopulation have let woods and scrub grow uninterrupted on land once farmed or grazed, increasing the amount of dry vegetation ready to burn;
- mountainous terrain: rugged areas like the Carpathians, the Apennines and the Balkan mountains make firefighting response slower and harder, so a fire that starts small is more likely to grow large and become visible from satellite, compared with a fire that starts on a plain where responders arrive sooner.
These factors explain why the underlying geography of risk repeats itself; on their own, they do not predict how severe any single season will be, which remains tied to how intense the heatwaves are and how much time passes between one rainfall and the next in that specific year.
2026 already at two-thirds of the 2025 record
The numbers confirm what the maps suggest at a glance: across the twenty-seven EU countries tracked by EFFIS, 2025 was an exceptional year, with roughly 1,035,000 hectares burned over the entire season. 2026, as of mid-August, has already passed 620,000 hectares: 60% of the 2025 total, with weeks of risk still ahead in the season. Compared with the long-term historical average — a little over 350,000 hectares burned in a typical year — 2026 is already at 160% of that average, while still running at more contained levels than the previous year. The overall picture, in short, is of a season less dramatic than the last one but still well above the norm of the past two decades.
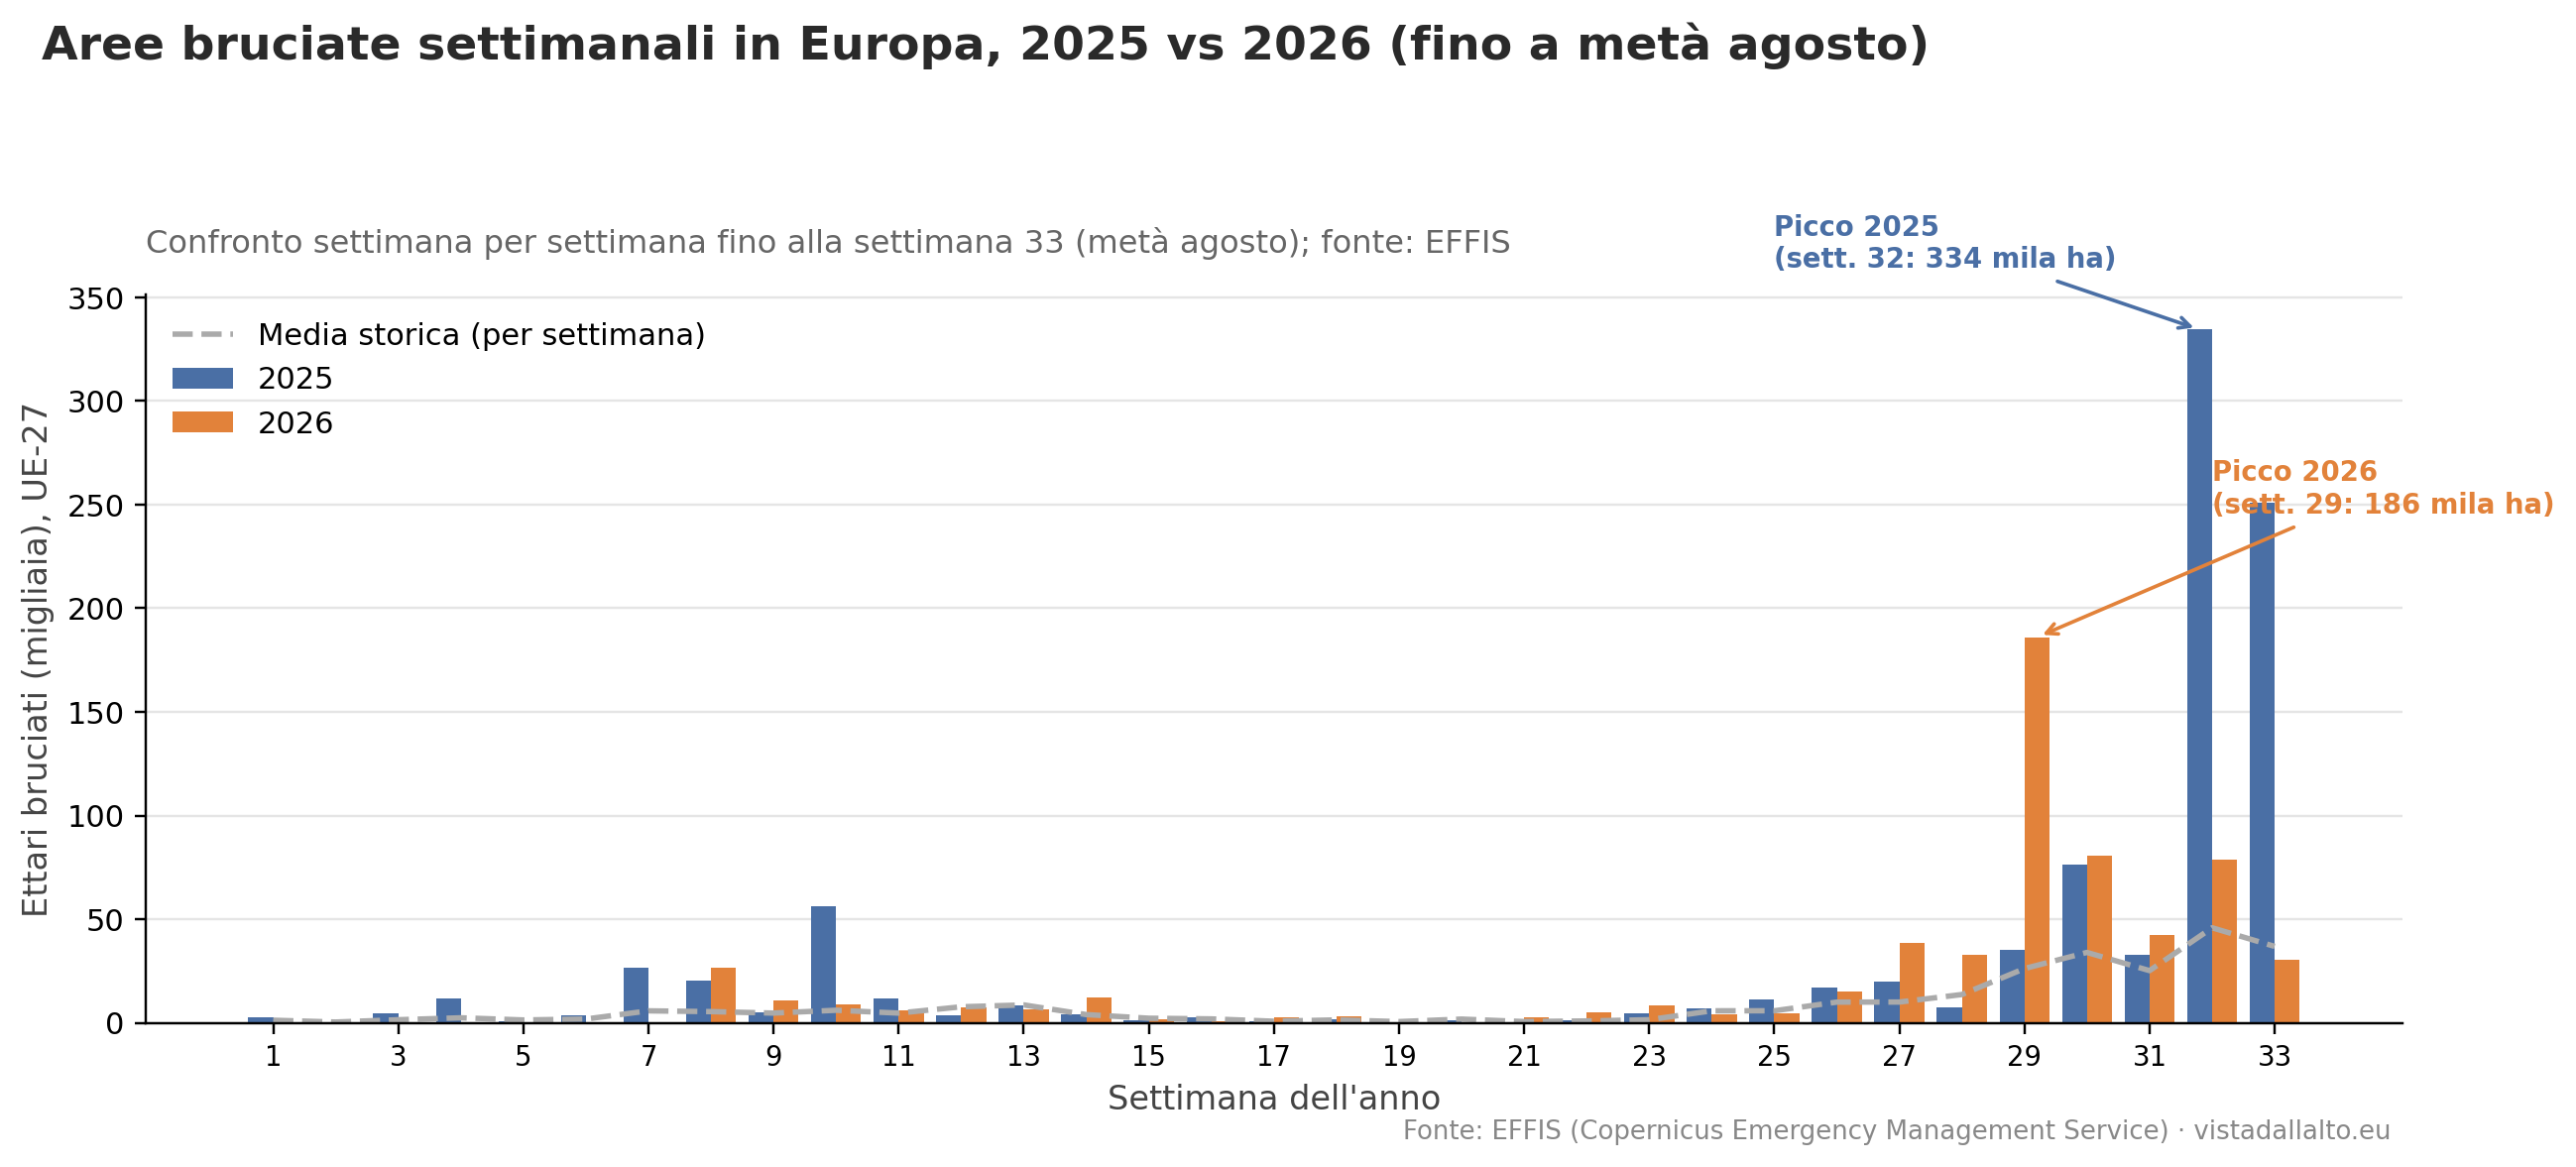
Figure 2 — Hectares burned per week in the EU-27, 2025 vs 2026, through week 33 (mid-August). The 2025 season shows an isolated, exceptional spike in the week of 4-10 August (largely driven by the fires in Portugal); 2026 had a more contained and earlier peak, in late July. Source: EFFIS.
The weekly chart shows the difference between the two seasons clearly: 2025 was running roughly in line with the historical average until late July, then exploded into a single catastrophic week that alone burned more hectares than most of the other 51 weeks combined. In numbers: the two worst weeks of 2025 (those of the Portuguese wildfires, in early August) accounted on their own for 61% of all the area burned in the first eight months of the year. 2026 has had a more “distributed” pattern: its peak, in late July, is still above the historical average but only about half the record set in 2025, and its two worst weeks account for 43% of the total — significant, but noticeably less than in 2025.
The geography of fire shifts from year to year
The most interesting finding emerges when breaking the total down by country, because the map of risk shifts significantly from one year to the next. In 2025 the record undisputedly belonged to Portugal, where fires burned over 278,000 hectares, more than 3% of the entire national territory — the highest share among all EU countries. Spain followed (nearly 393,000 hectares in absolute terms, the highest figure but over a larger territory) and Romania (over 129,000 hectares).
In 2026, at mid-season, the geography is different. France and Italy have already matched or exceeded their entire 2025 total: France went from roughly 37,000 to over 96,000 hectares burned, a two-and-a-half-fold increase, while Italy has already reached 86,700 hectares, more than the whole of 2025 (84,300), with the season still open. At the opposite end, the countries that paid the highest price in 2025 are, for now, showing a clear improvement: Portugal stands at 63,000 hectares, less than a quarter of the record year’s total; Spain is at roughly 299,000 hectares, below its 2025 level but still the highest absolute figure in Europe; Bulgaria and Romania have both dropped to less than a seventh of their respective 2025 totals.
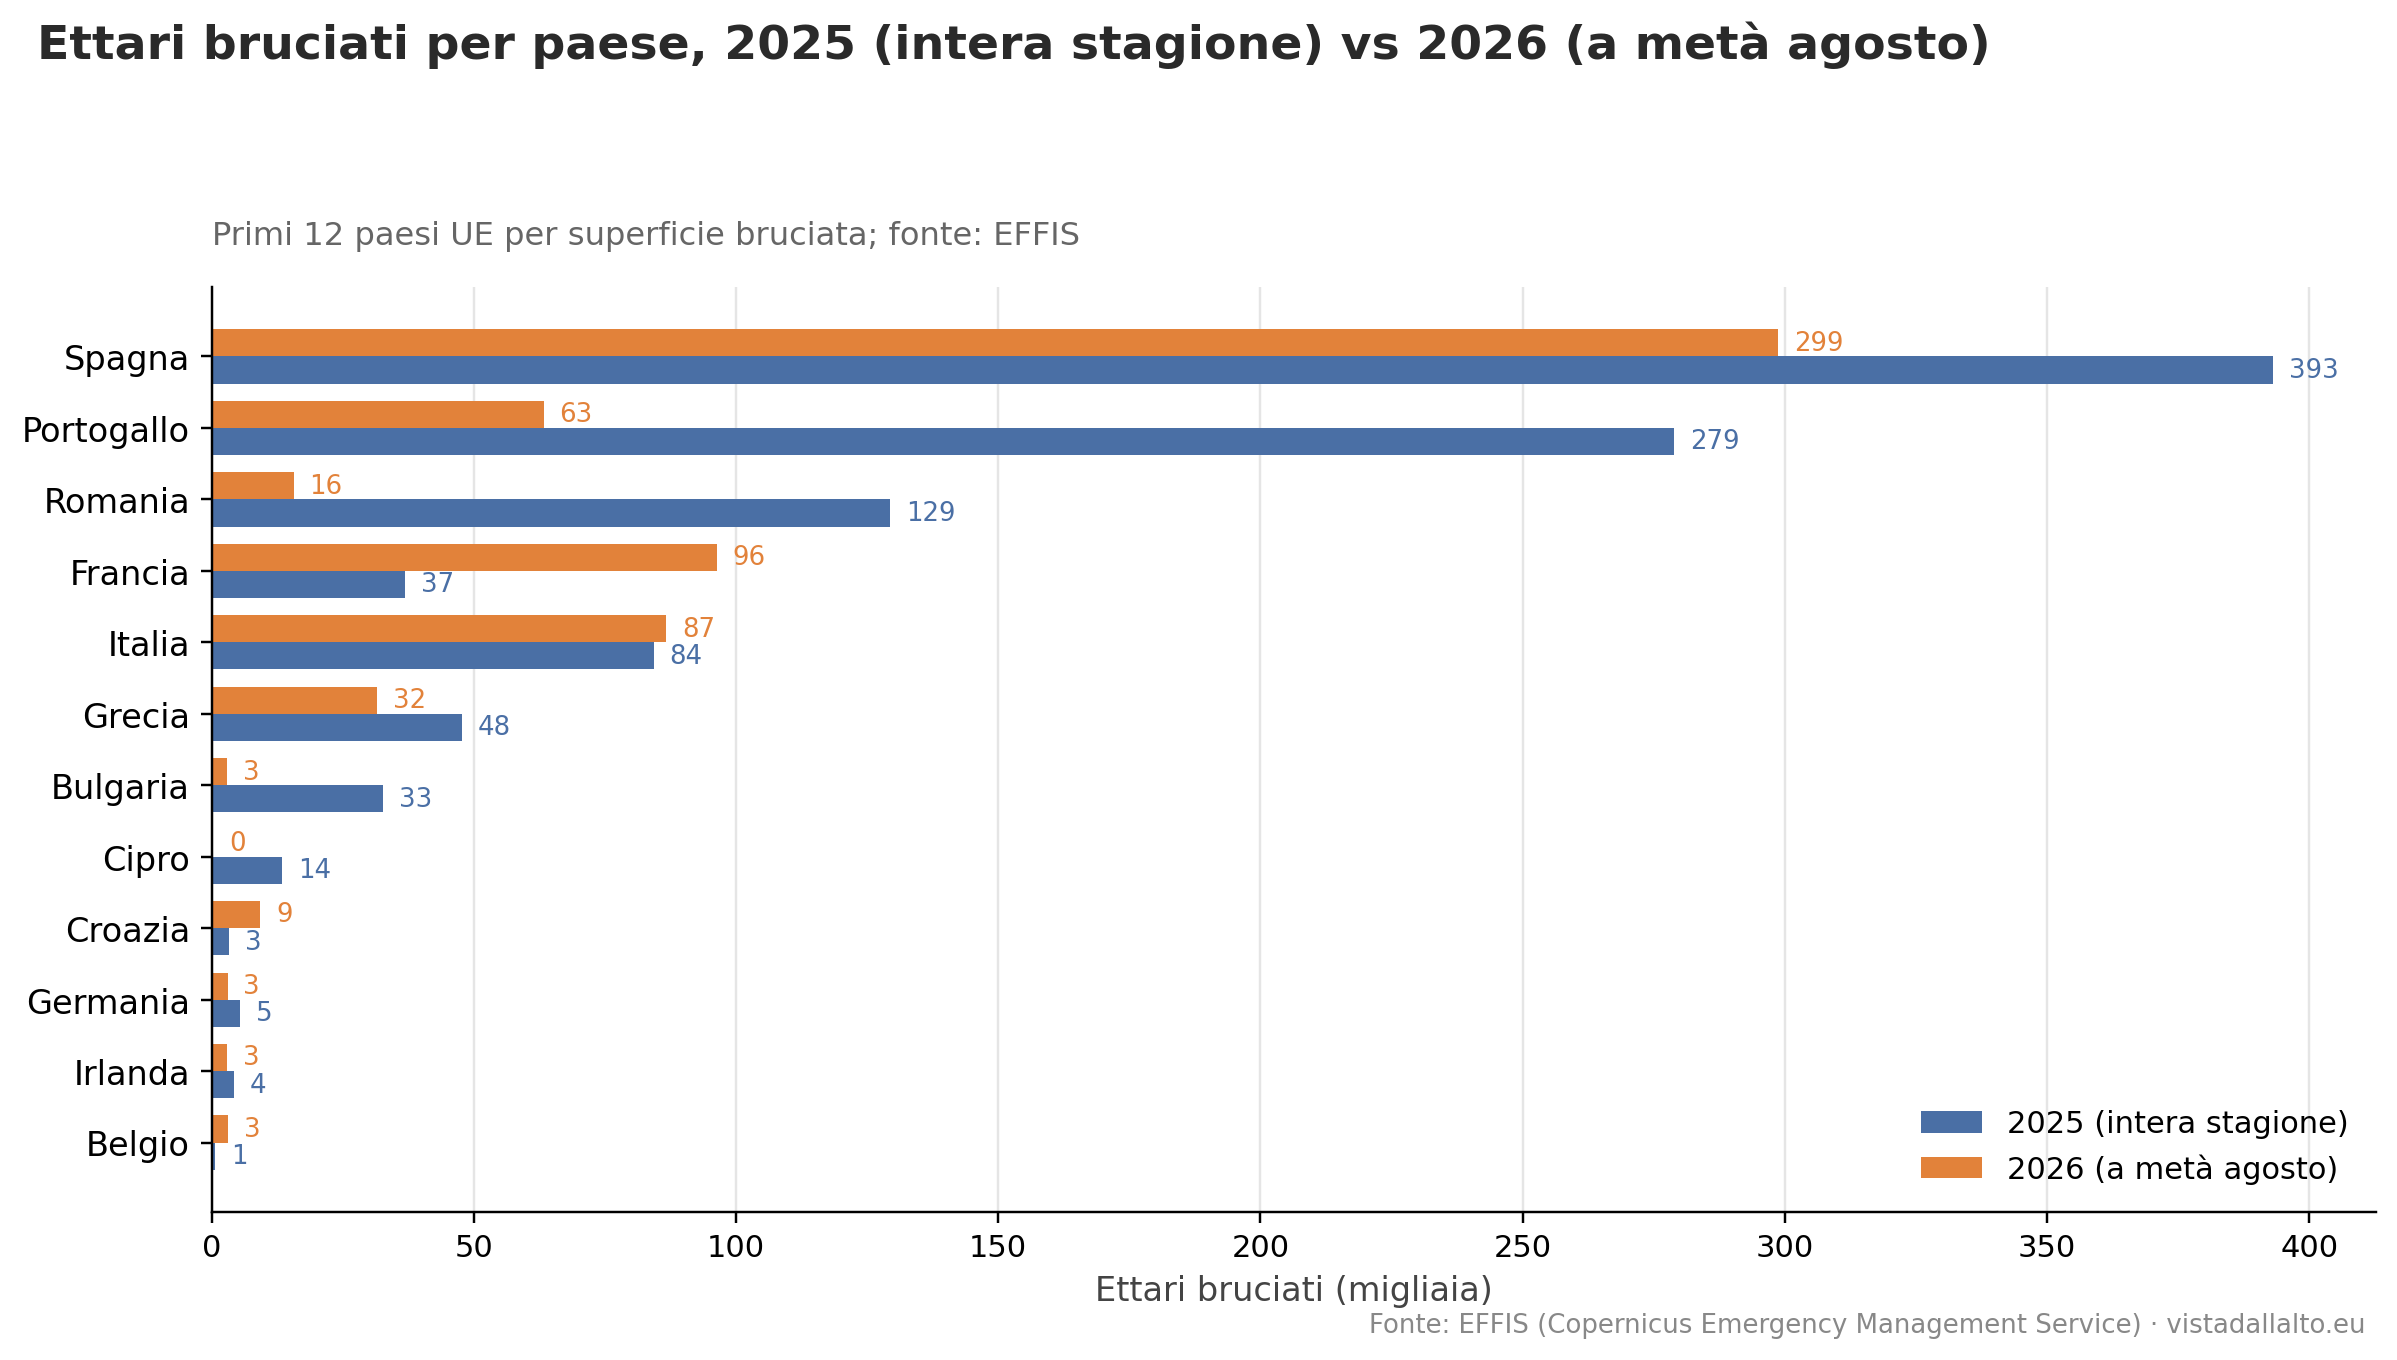
Figure 3 — Hectares burned by country, the top twelve by total area: the entire 2025 season compared with the 2026 figure updated to mid-August. Source: EFFIS.
The change in hectares: the traffic-light map
To read the same dynamic at a glance, the map below reuses the choropleth layout already used elsewhere on this site, but recasts it in a differential key: each country is colored according to the absolute change in hectares burned — not scaled to national territory — between the entire 2025 season and the 2026 season (mid-August). The color code is a three-color traffic light, with a threshold of ±3,000 hectares below which the change is treated as noise rather than a real signal:
- green, improvement: at least 3,000 fewer hectares burned in 2026 than in 2025 (Portugal, Romania, Spain, Bulgaria, Greece, Cyprus);
- yellow, essentially stable: change within ±3,000 hectares (most countries, including Italy, which — despite having already exceeded the whole of 2025 — does so by a margin of just over 2,000 hectares);
- red, worsening: at least 3,000 more hectares burned in 2026 than in 2025 (France, Croatia).
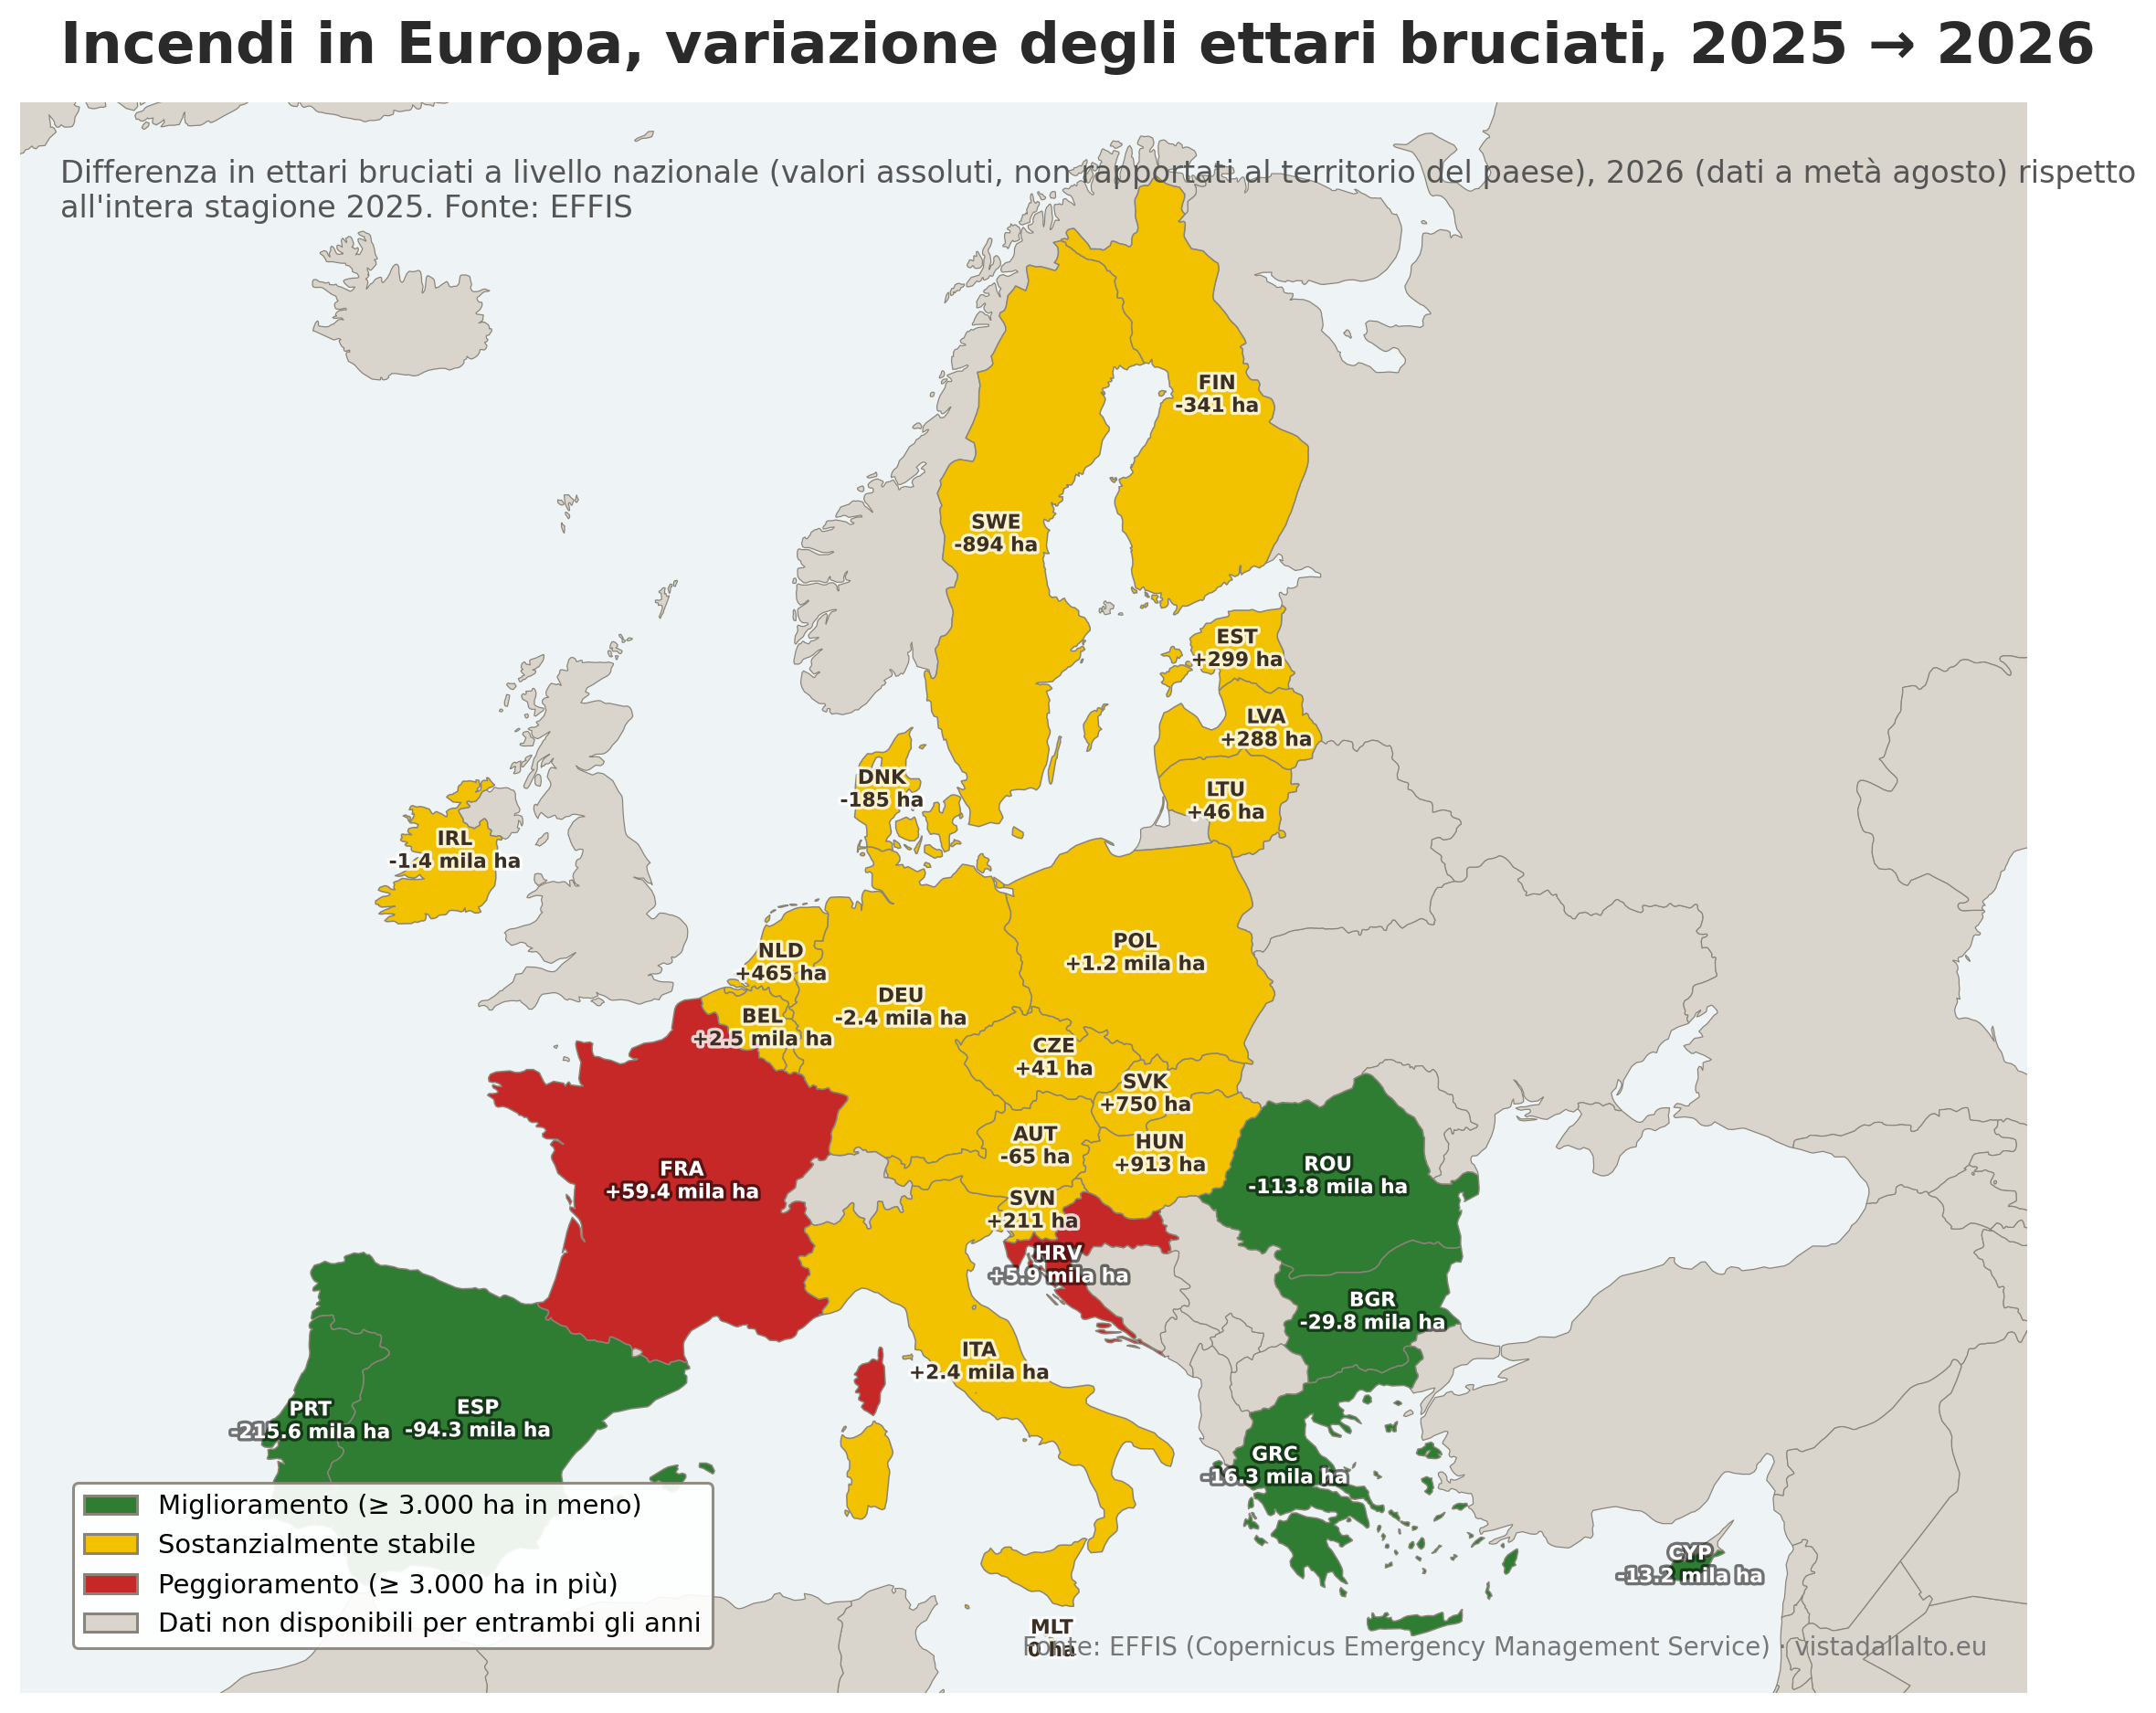
Figure 4 — Change in hectares burned at the national level (absolute values, not scaled to country area), 2026 (data to mid-August) compared with the entire 2025 season. Source: EFFIS, Copernicus Emergency Management Service.
In absolute terms France is, by a wide margin, the clearest case of worsening in Europe: almost 59,400 more hectares than in 2025, more than ten times the increase seen in Croatia (+5,900 hectares), the only other country classified as red. On the opposite side, the drop in Portugal (−215,600 hectares) and Romania (−113,800 hectares) is an order of magnitude larger than any other change recorded, followed by Spain (−94,300), Bulgaria (−29,800), Greece (−16,300) and Cyprus (−13,200). Italy, despite having already burned more hectares in 2026 than in the whole of 2025, remains in the yellow zone: the absolute difference (+2,389 hectares) is below the noise threshold chosen for this map.
Methodological note
The interactive map at the top and the static maps in this article use two distinct EFFIS WMS/WMTS service layers: for 2025, the consolidated “season” layer validated at year-end (modis.ba.2025); for 2026, the “current season” layer (modis.ba.season), which updates near real-time and colors each detection according to how long ago it was recorded — from red (last day) to green (over 30 days ago, within the current season). Being a non-consolidated layer, it may include preliminary detections not yet validated in final form, and may be temporarily incomplete during peak load on the EFFIS server. For this reason the visual comparison between the maps should be read as a comparison of geographic detection patterns, while the burned-area figures cited in the text come directly from official EFFIS statistics (the estimatesoverview and weeklyaoi endpoints), not from a count of detections on the maps.
The spatial-recurrence analysis (“Why (almost) always the same places?”) compares tiles of the EFFIS WMTS grid (roughly 150 km per side at the zoom level used for the maps) between the two seasons: a tile is considered “active” in a given year if at least 0.5% of its pixels show a burned-area detection. This is therefore a regional-resolution comparison, useful for identifying recurring macro-areas, not an analysis of individual fires or their direct causes.
Sources: EFFIS — European Forest Fire Information System, Copernicus Emergency Management Service (data updated to 19 August 2026); cartographic elaboration by Piero Boccardo, Politecnico di Torino.