Texas and Kansas, the geography of a wave
Where the votes moved in the 2026 midterms, county by county
by Piero Boccardo
Two years ago Donald Trump won Texas by almost 14 points and Kansas by more than 16. On Tuesday the Democrat James Talarico beat Ken Paxton for the Texas Senate seat by 12 points, and in Kansas the Methodist pastor Adam Hamilton defeated the incumbent senator Roger Marshall by 5, becoming the first Democrat elected to the Senate from that state since 1932. Commentary in recent days explains the result with the cost of living and the president’s unpopularity, and the exit polls bear it out. Two questions remain that exit polls cannot answer: where the votes moved, and why they moved much more in some counties than in others.
To try to answer them I lined up the results of all 359 counties in the two states for the elections from 2016 to 2026 and cross-referenced them with the make-up of the population and with their position on the map.
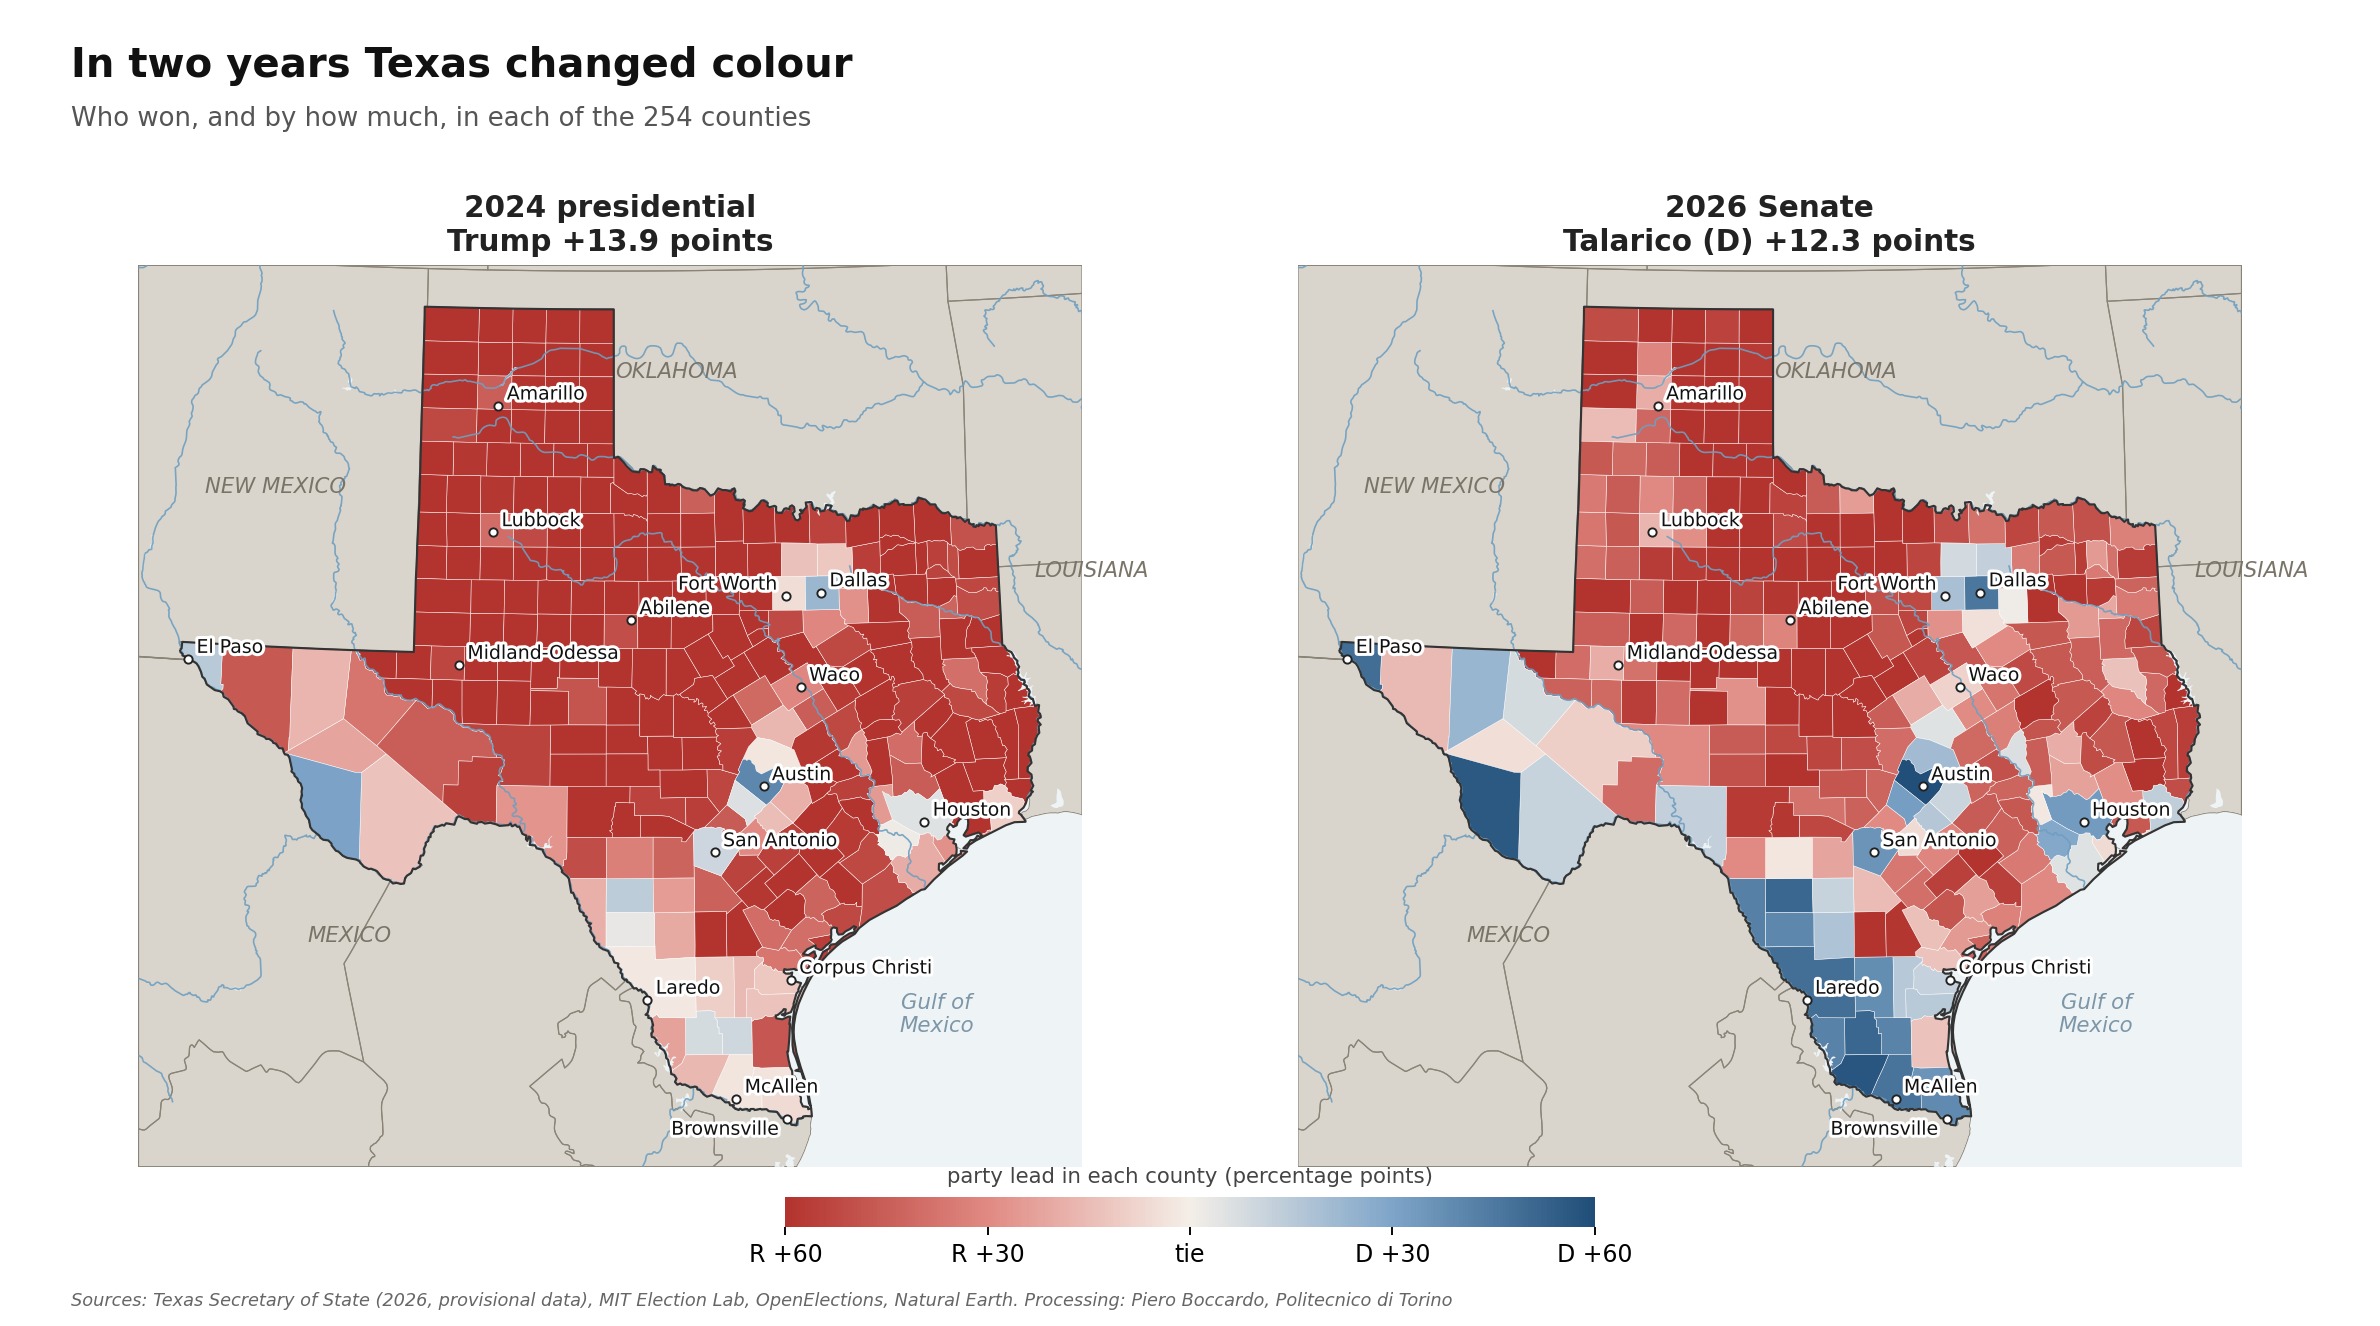 Figure 1. Texas, lead of the winning party in each of the 254 counties in the 2024 presidential election and the 2026 Senate race. Source: Texas Secretary of State (provisional data), MIT Election Lab.
All in the same direction
In Texas the shift towards the Democrats, measured on the vote for the two parties, is about 26 points, and it covers all 254 counties: none moved the other way. The intensity varies a great deal. In the rural counties of the north and west the Republican margin shrank by 6 or 7 points, in the Rio Grande Valley by 40 or 50, up to the 73 points of Starr County, which went from Trump +16 to Talarico +57.
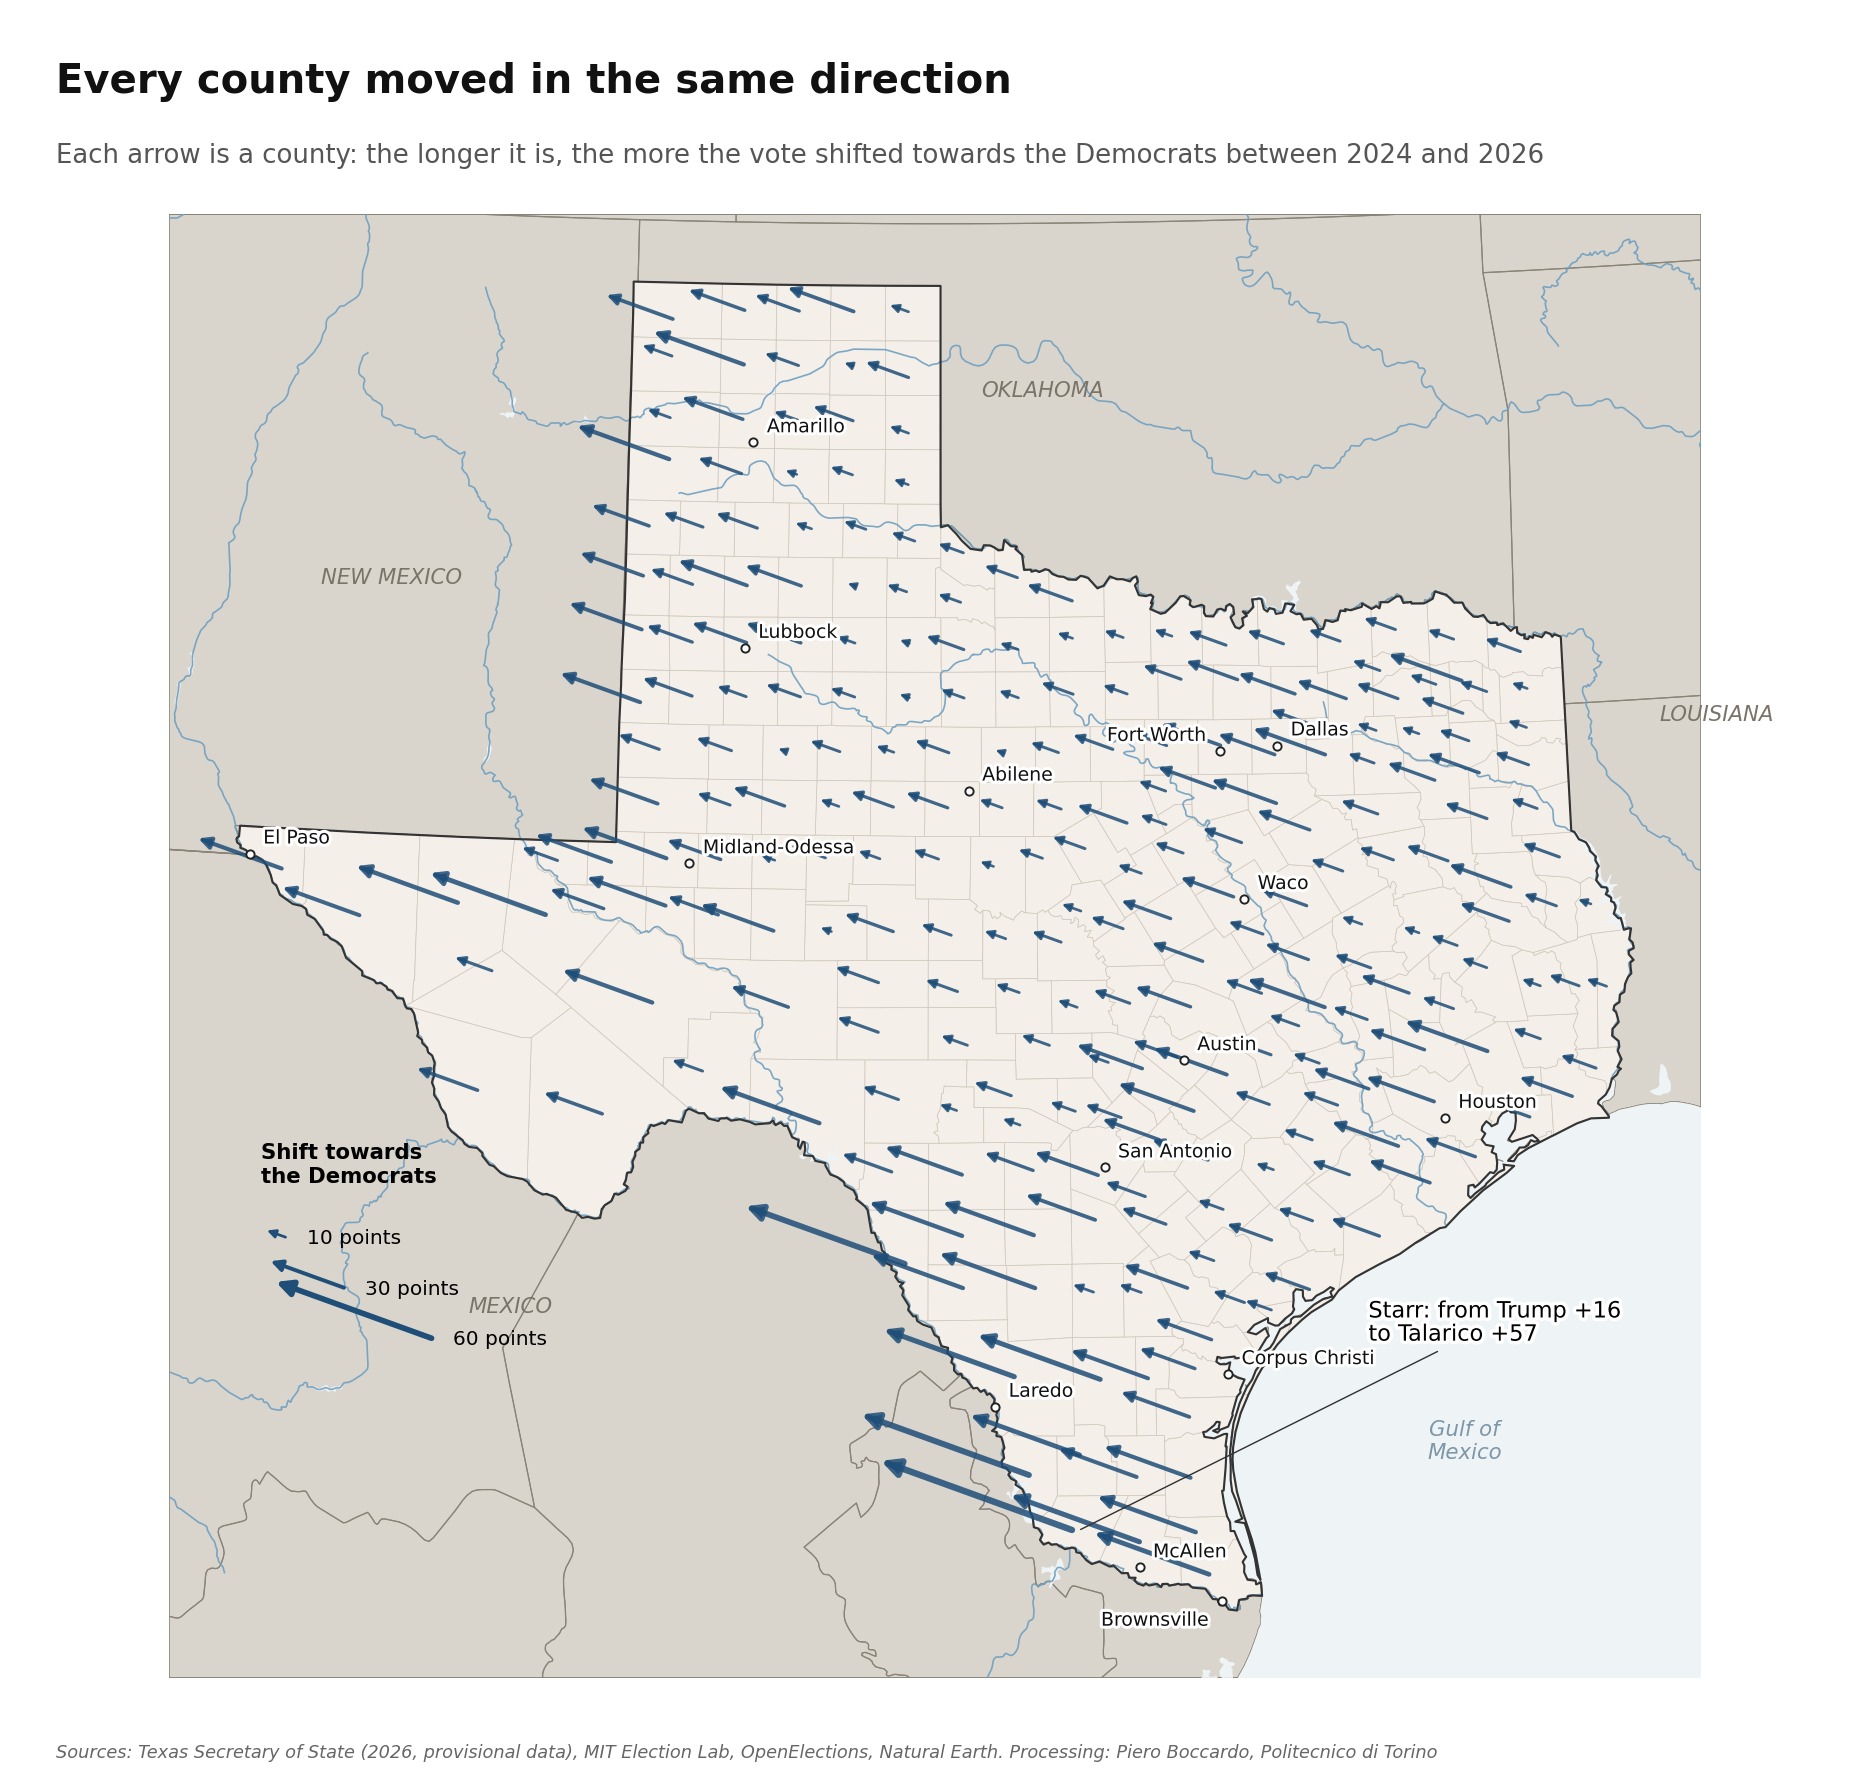 Figure 2. Each arrow is a county: its length shows how many points the margin moved towards the Democrats between 2024 and 2026. Source: Texas Secretary of State, MIT Election Lab.
Where the votes went
The most useful number for understanding what happened is the simplest one. Paxton won 4,249,000 votes; Ted Cruz, in the 2018 midterm, had won 4,261,000: a difference of eleven thousand votes out of more than four million. The Republican Party brought its midterm electorate to the polls, no more and no less. Missing are the two million extra voters Trump had mobilised in 2024, who this time stayed at home.
That alone does not explain the result. Talarico won 5,445,000 votes, 35% more than Beto O’Rourke in 2018 and 13% more than Kamala Harris two years ago, in a midterm election in which turnout is normally lower.
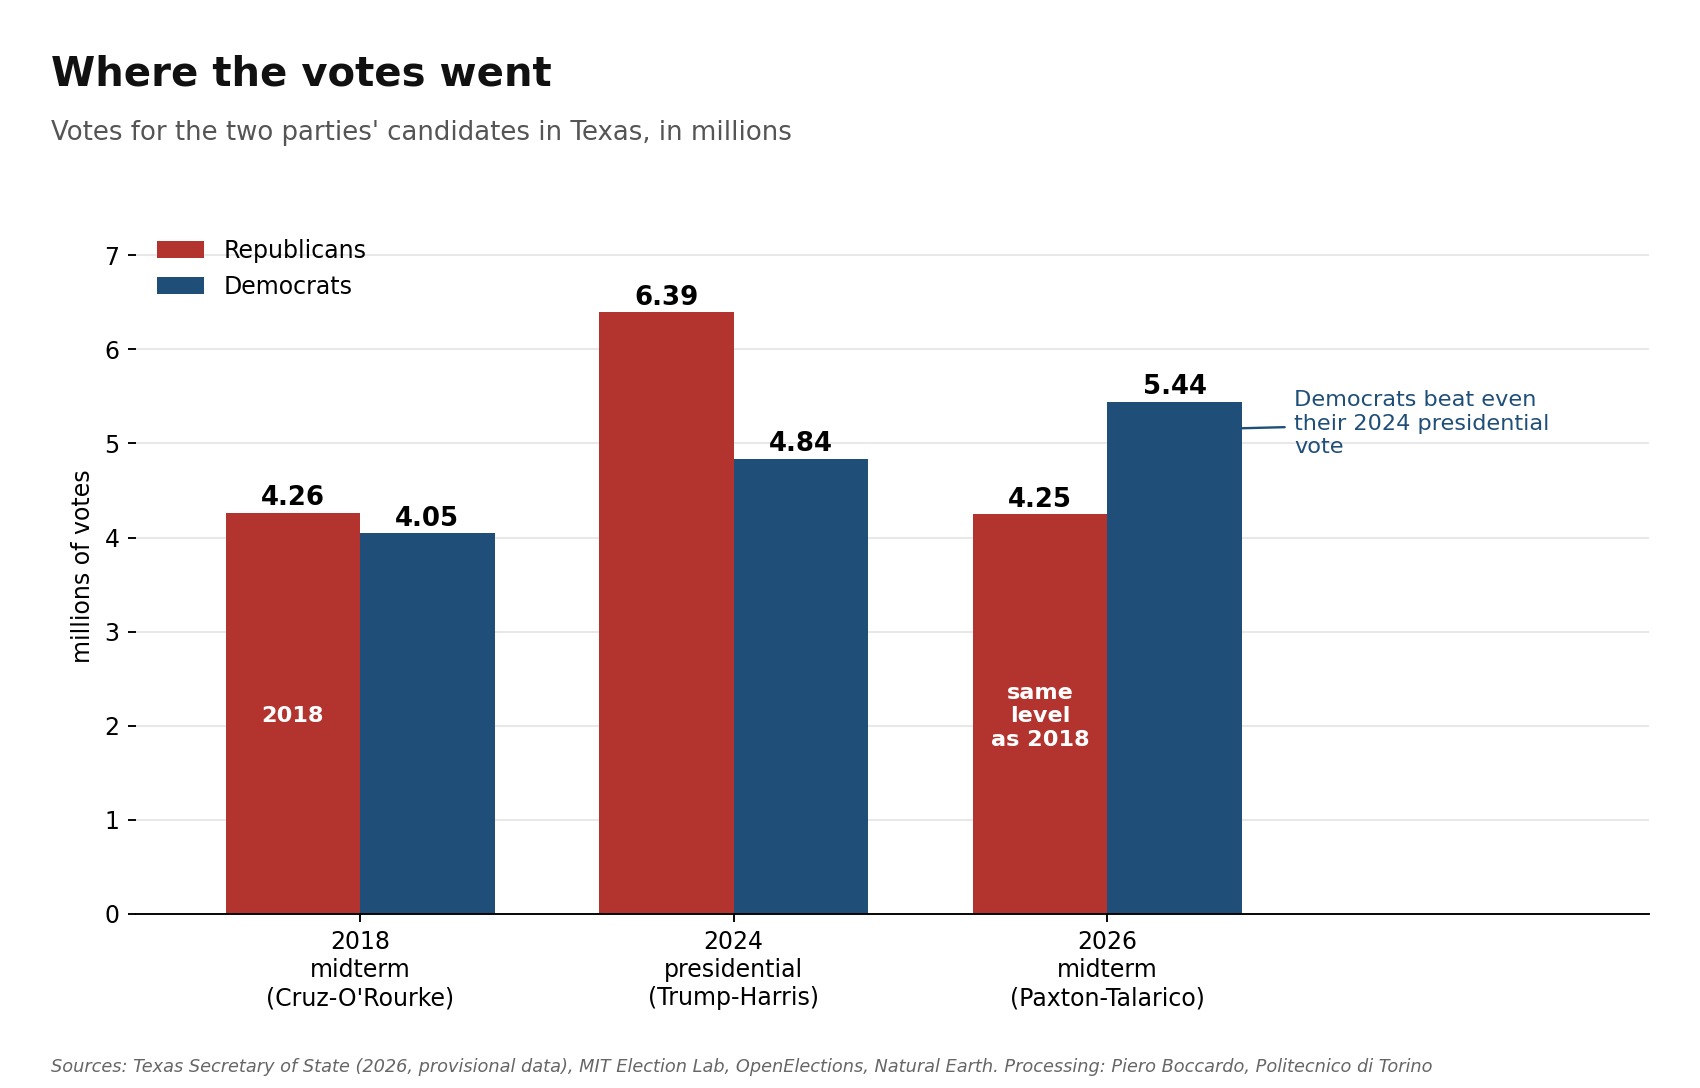 Figure 3. Votes for the Republican and Democratic candidates in Texas, in millions. Source: Texas Secretary of State, OpenElections, MIT Election Lab.
The rubber band effect
Comparing counties reveals a clear regularity: those that moved most towards Trump between 2020 and 2024 are the ones that swung back most in 2026, and on average they went past their starting point. For every point Trump gained in 2024 the Republicans lost a little more than one in 2026, and this relationship alone accounts for half of the differences between counties.
The twenty border counties where Hispanics are more than 75% of the population are the clearest example. In 2020 they voted Democratic by 22 points, in 2024 they had come close to a tie (D +1), in 2026 Talarico wins them by 45 points. The five large urban counties (Houston, Dallas, Fort Worth, San Antonio, Austin) go from D +12 to D +37, the rest of the state from R +35 to R +12.
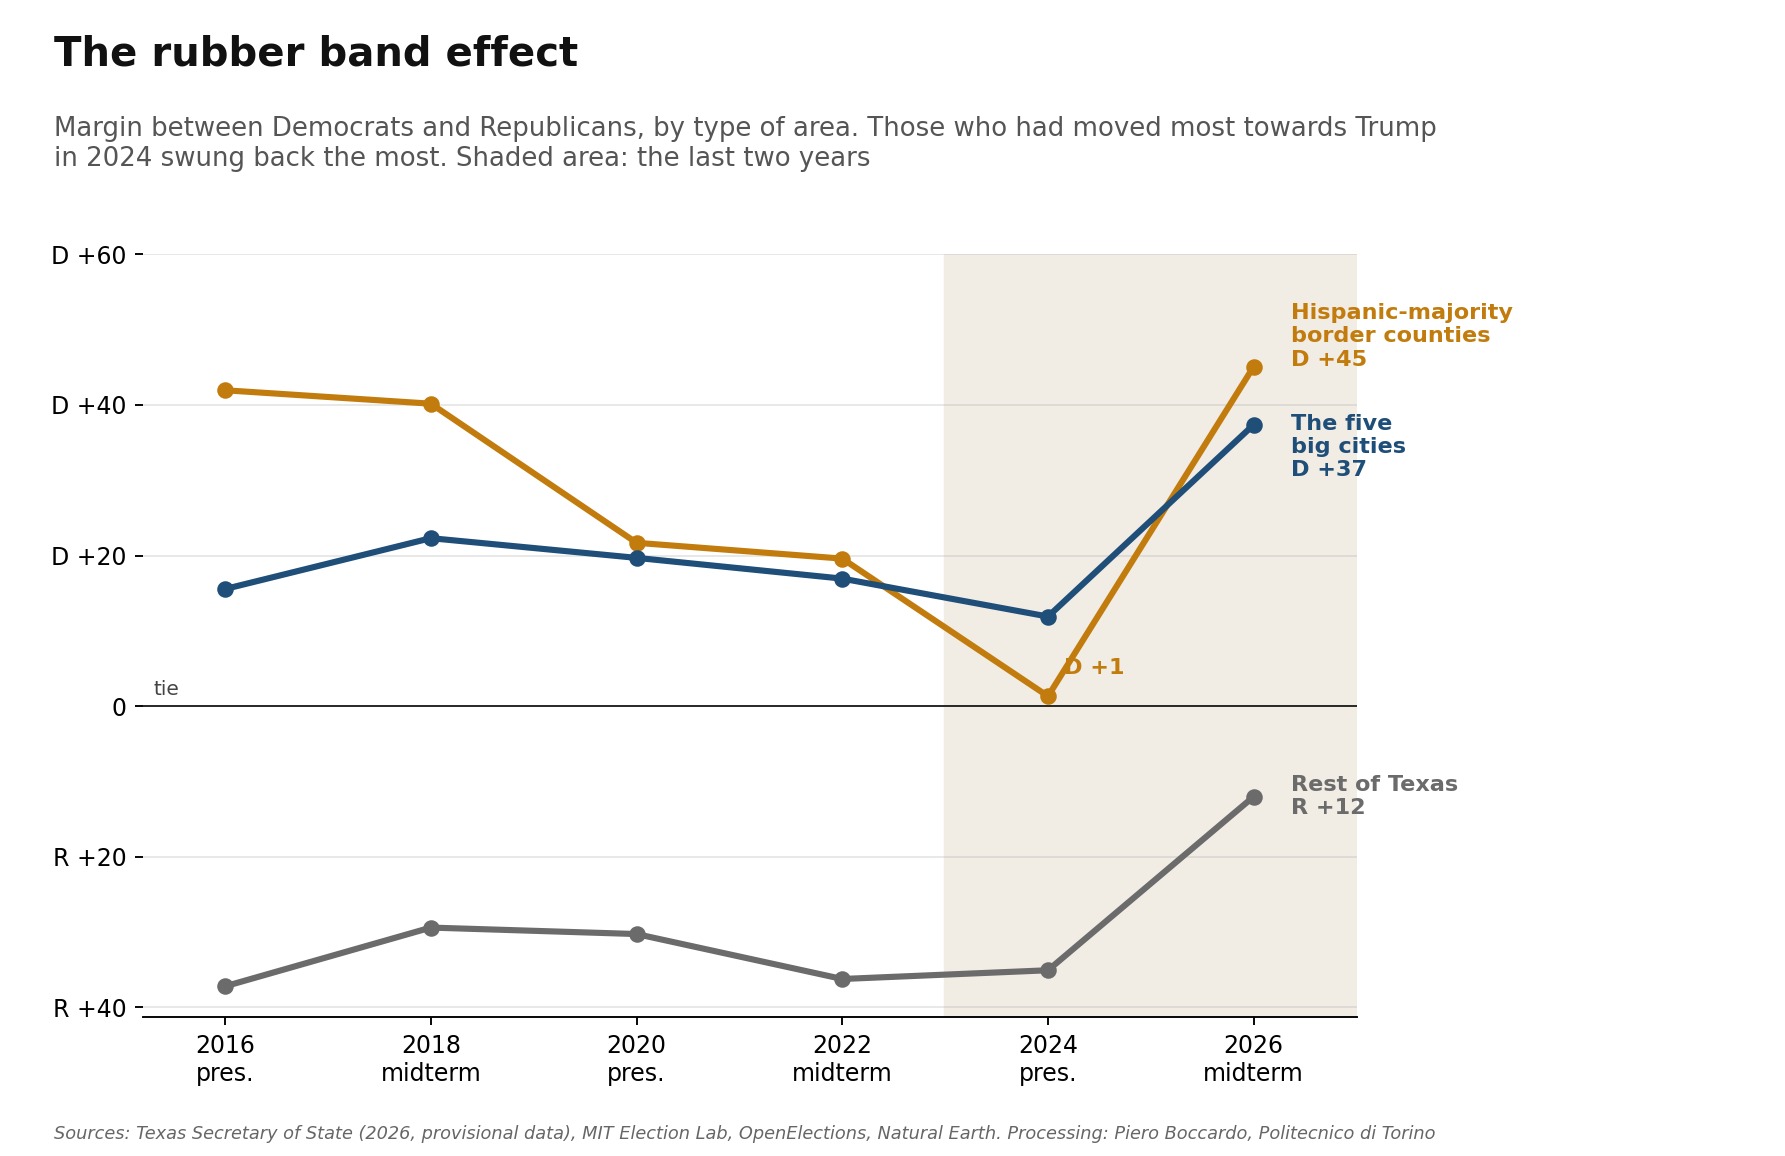 Figure 4. Margin between Democrats and Republicans by type of area, from 2016 to 2026. Source: Texas Secretary of State, MIT Election Lab, OpenElections.
Two ways of losing
The rubber band, however, moves for different reasons depending on the area. On the border Republican votes are half those of 2024 but 8% more than in 2018: the missing voters are the ones who came with Trump, not those who vote Republican at every midterm. In white-majority counties, where Hispanics are less than a quarter of the population, Republicans hold their midterm electorate (+5% on 2018), while Democratic votes grow by half. There, Democratic mobilisation decided the race.
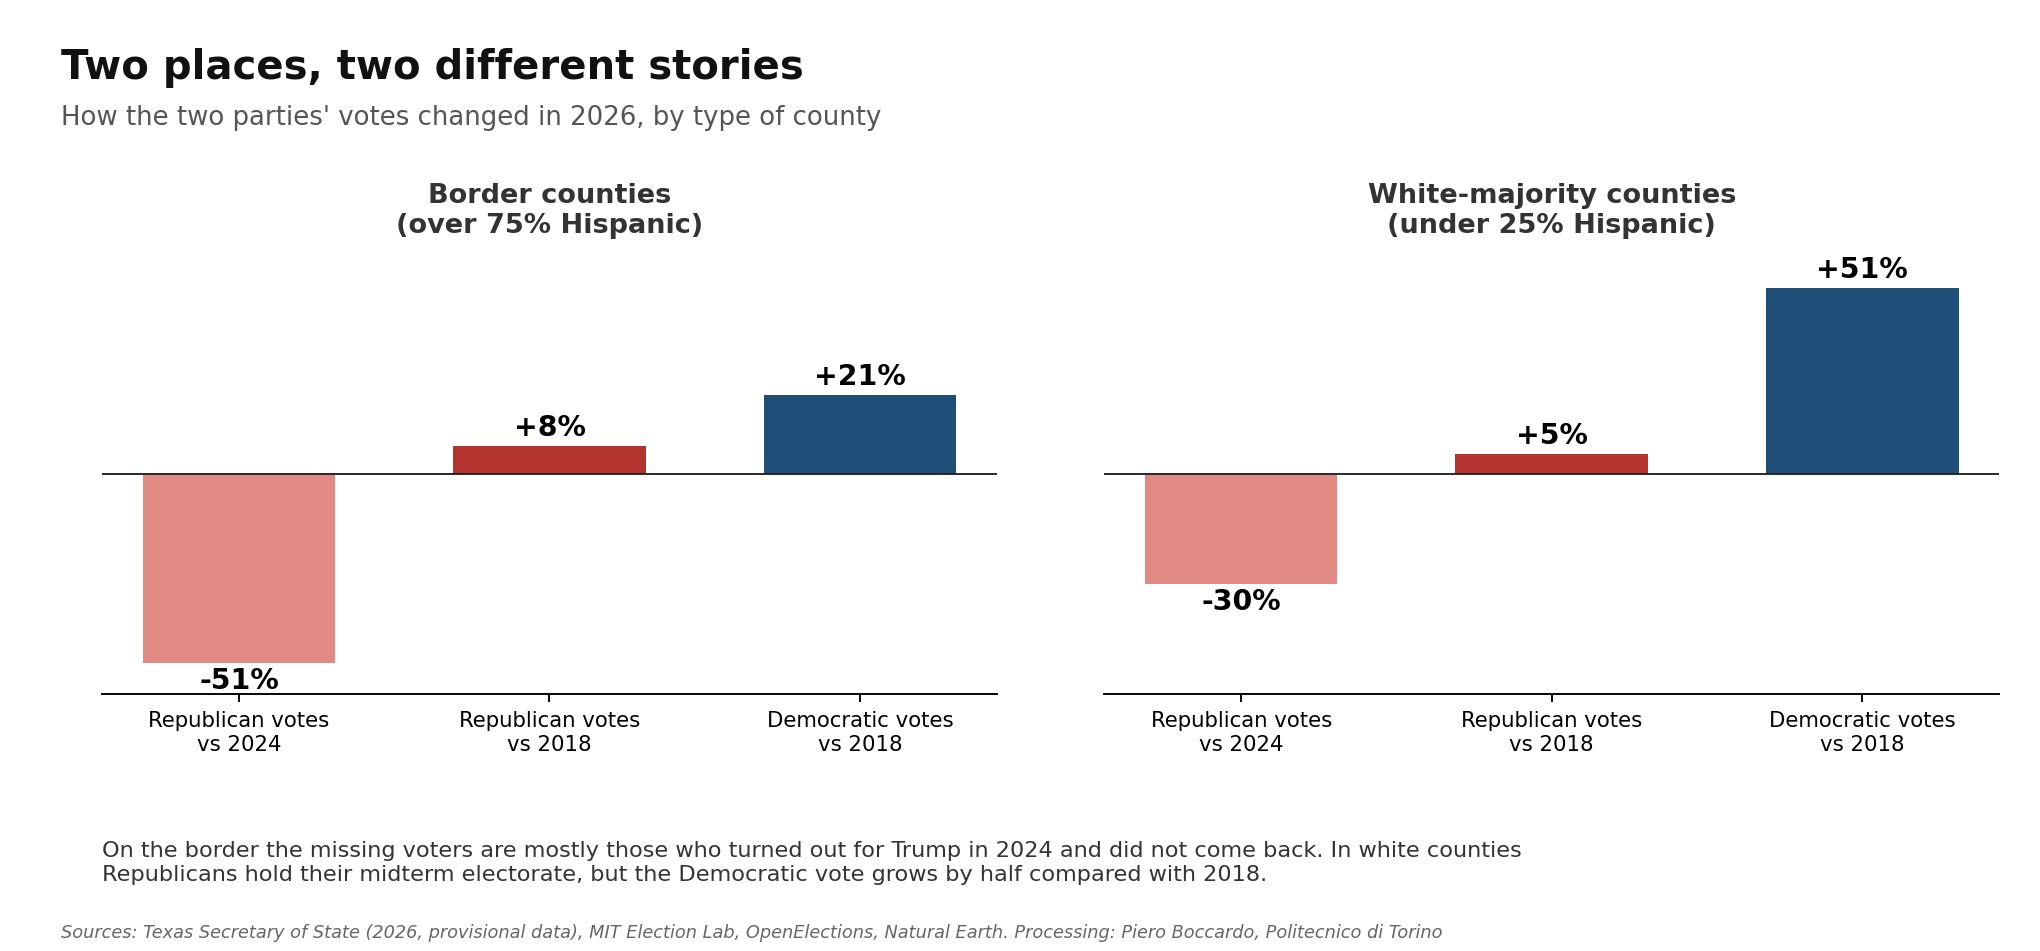 Figure 5. Change in the two parties’ votes in 2026 compared with 2024 and with the 2018 midterm, in border counties and in white-majority counties. Source: Texas Secretary of State, OpenElections, MIT Election Lab.
Where the vote surprised
The share of Hispanics, age, education, income and population density together explain about four fifths of the differences in the shift between Texas counties. The rest is not randomly distributed: counties that moved more or less than expected tend to lie close together. The most compact group of counties where Republicans held up better than demographics would suggest coincides with the Permian Basin, around Midland and Odessa, and with the northern Panhandle: oil and gas country. In the opposite direction the Rio Grande Valley stands out again, together with part of the Hill Country west of Austin and the Dallas area.
I also tested a hypothesis drawn from the news. The July 2025 floods in the Hill Country, with a federal disaster declaration covering 23 counties, leave no trace in the vote: the affected counties moved exactly like the others once the make-up of their population is taken into account.
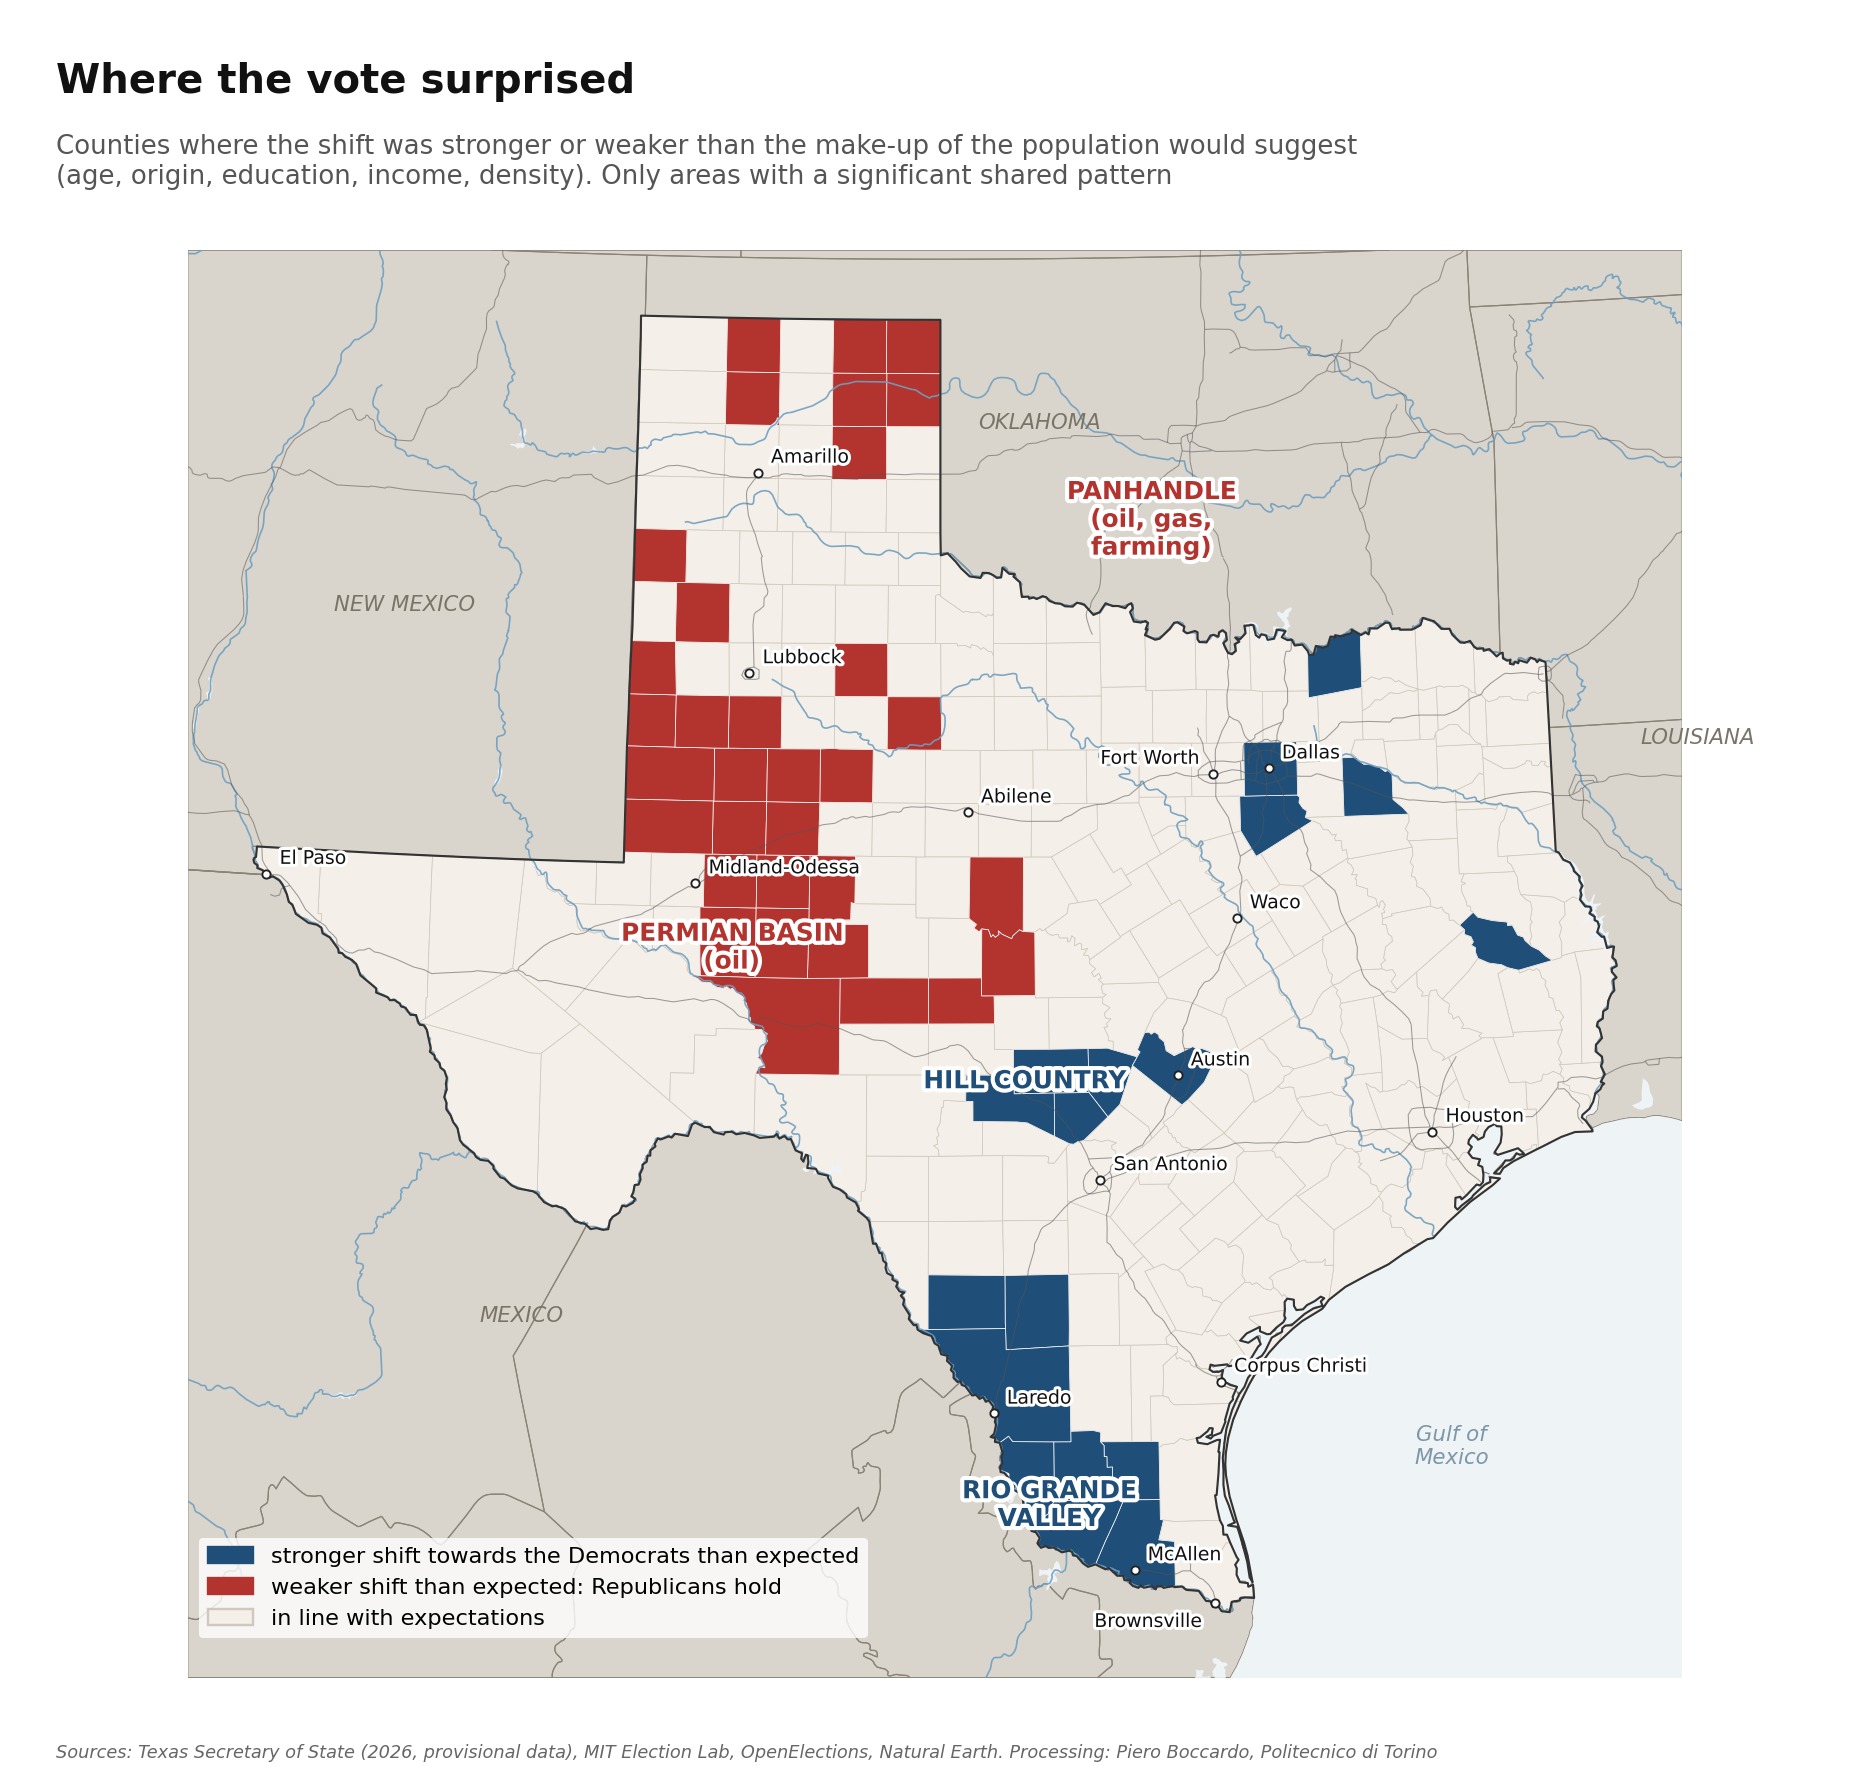 Figure 6. In blue the areas where the shift towards the Democrats was stronger than the make-up of the population predicts, in red those where it was weaker. Source: author’s processing of Texas Secretary of State and MIT Election Lab data.
Kansas
In Kansas the picture is similar, with smaller numbers. The shift is about 21 points and, here too, it covers all 105 counties. Compared with the 2022 Senate midterm, Republican votes fall by 16% and Democratic votes grow by 50%; Hamilton also slightly exceeds Harris’s 2024 vote.
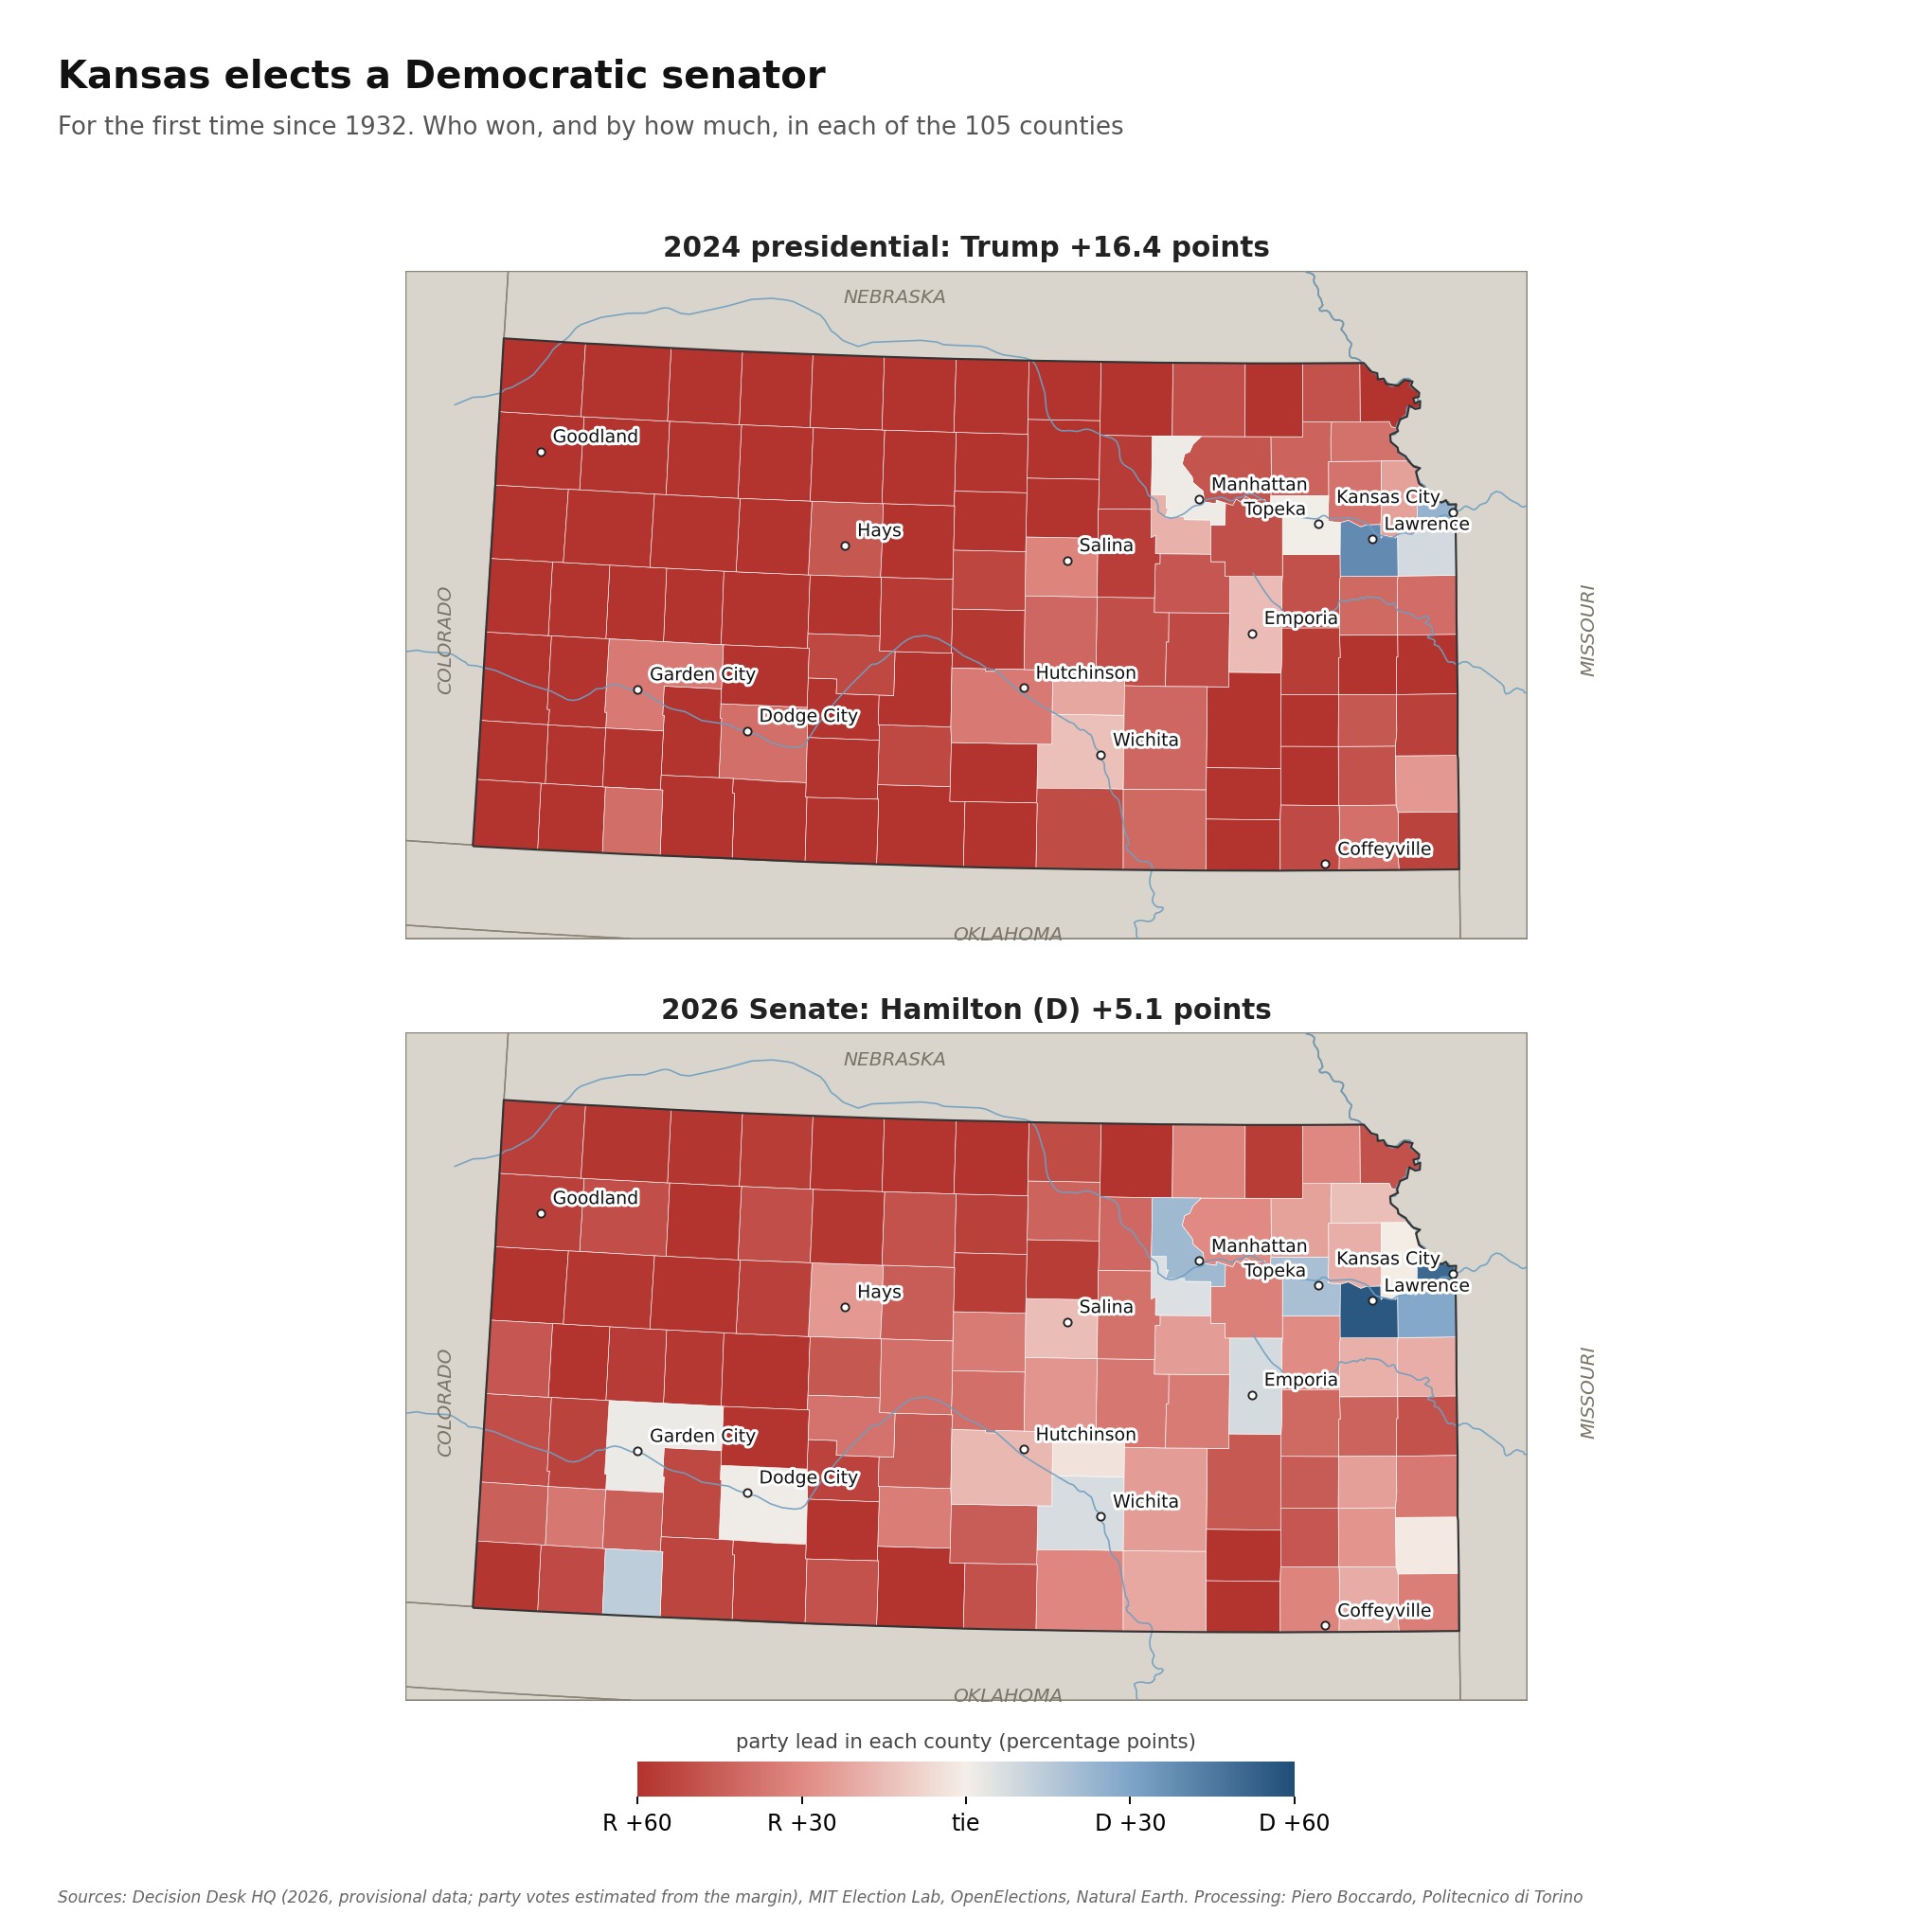 Figure 7. Kansas, lead of the winning party in each of the 105 counties in the 2024 presidential election and the 2026 Senate race. Source: Decision Desk HQ (provisional data), MIT Election Lab.
The rubber band shows up in the southwest of the state, in the counties of the large industrial meatpacking plants of Garden City, Dodge City and Liberal, where half the residents are of Hispanic origin. Seward County goes from Trump +40 to Hamilton +14, Ford and Finney from 35 or 40 Republican points to a near tie won by the Democrats. The urban areas (Kansas City, Wichita, Topeka, Lawrence and Manhattan), which cast 60% of the total vote, go from D +5 to D +25.
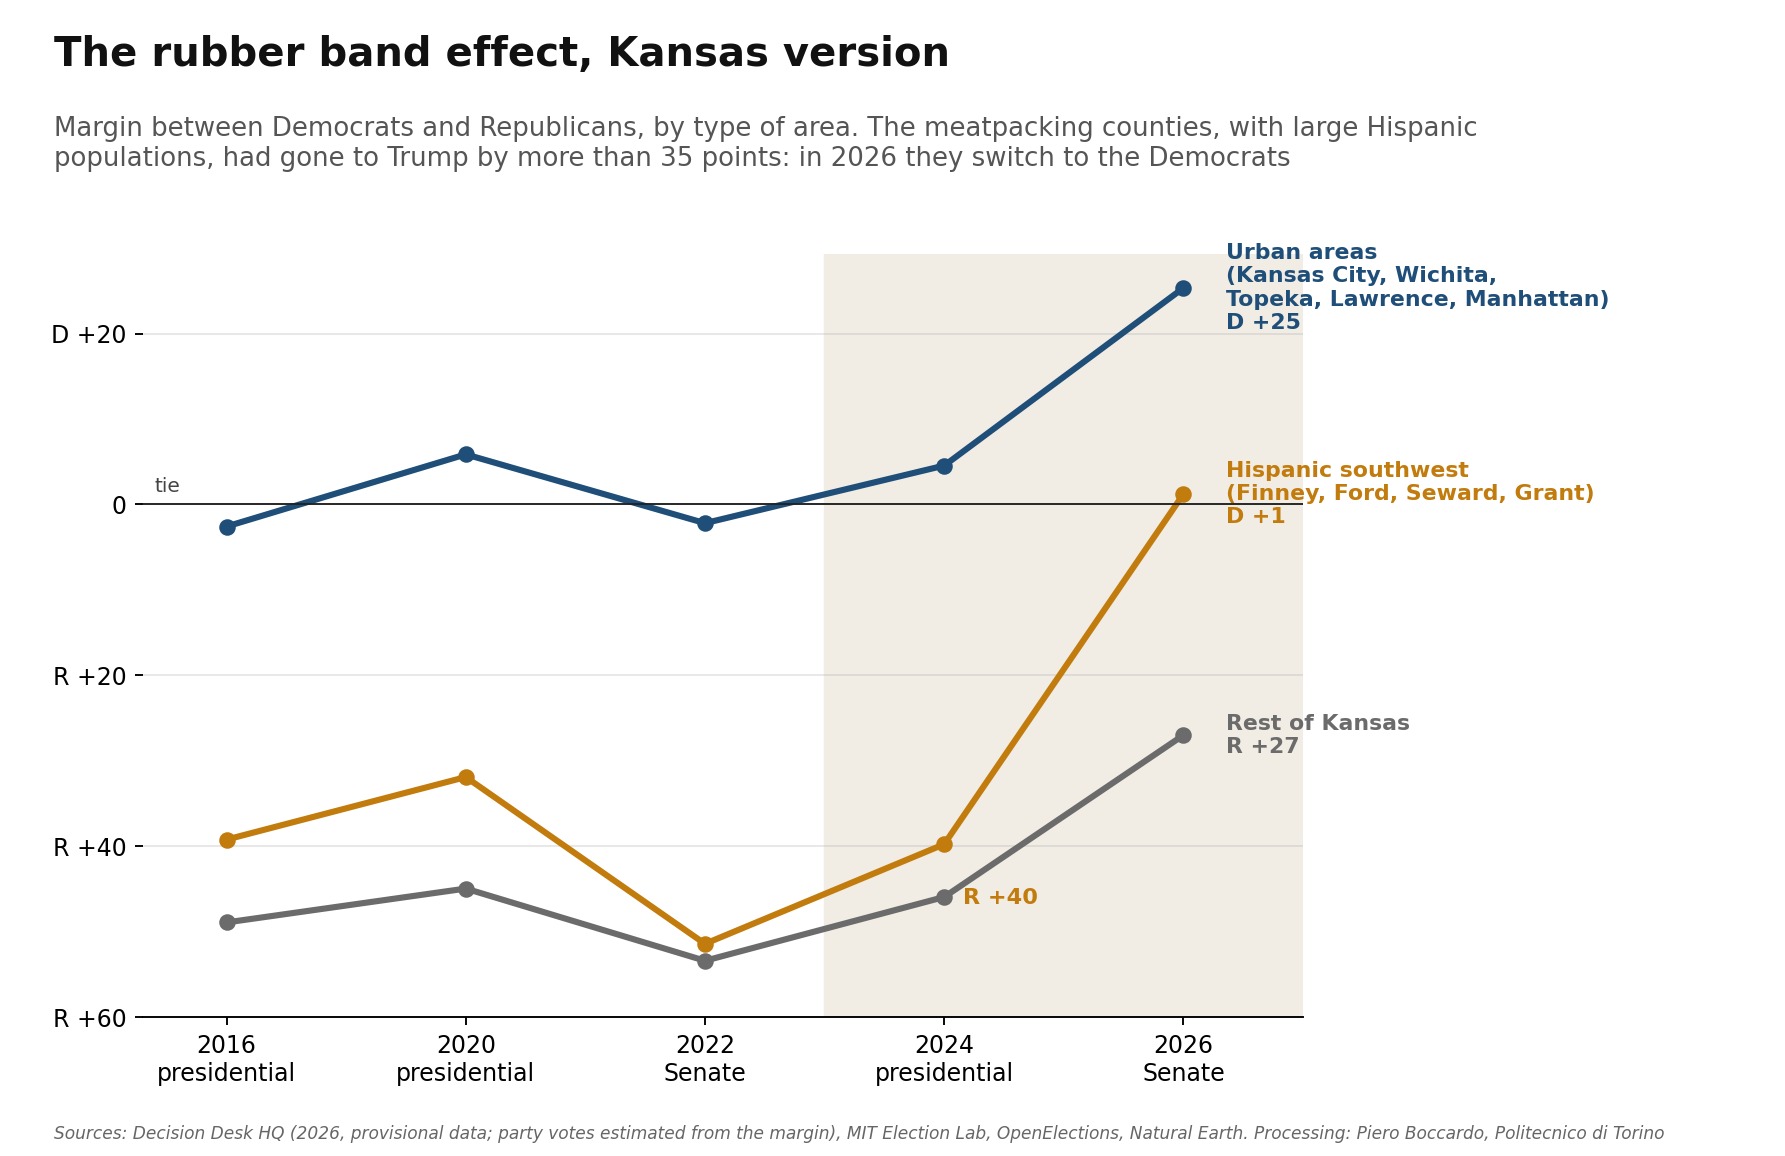 Figure 8. Margin between Democrats and Republicans by type of area in Kansas, from 2016 to 2026. Source: Decision Desk HQ, MIT Election Lab, OpenElections.
Unlike Texas, here the make-up of the population explains almost everything and little regional pattern remains. The only compact exception is the far west, on the border with Colorado, where Republicans held up better than expected: it is a land of natural gas and irrigated farming, geographically continuous with the Texas Panhandle. In the rural southeast, around Fort Scott and Chanute, the shift was stronger than expected.
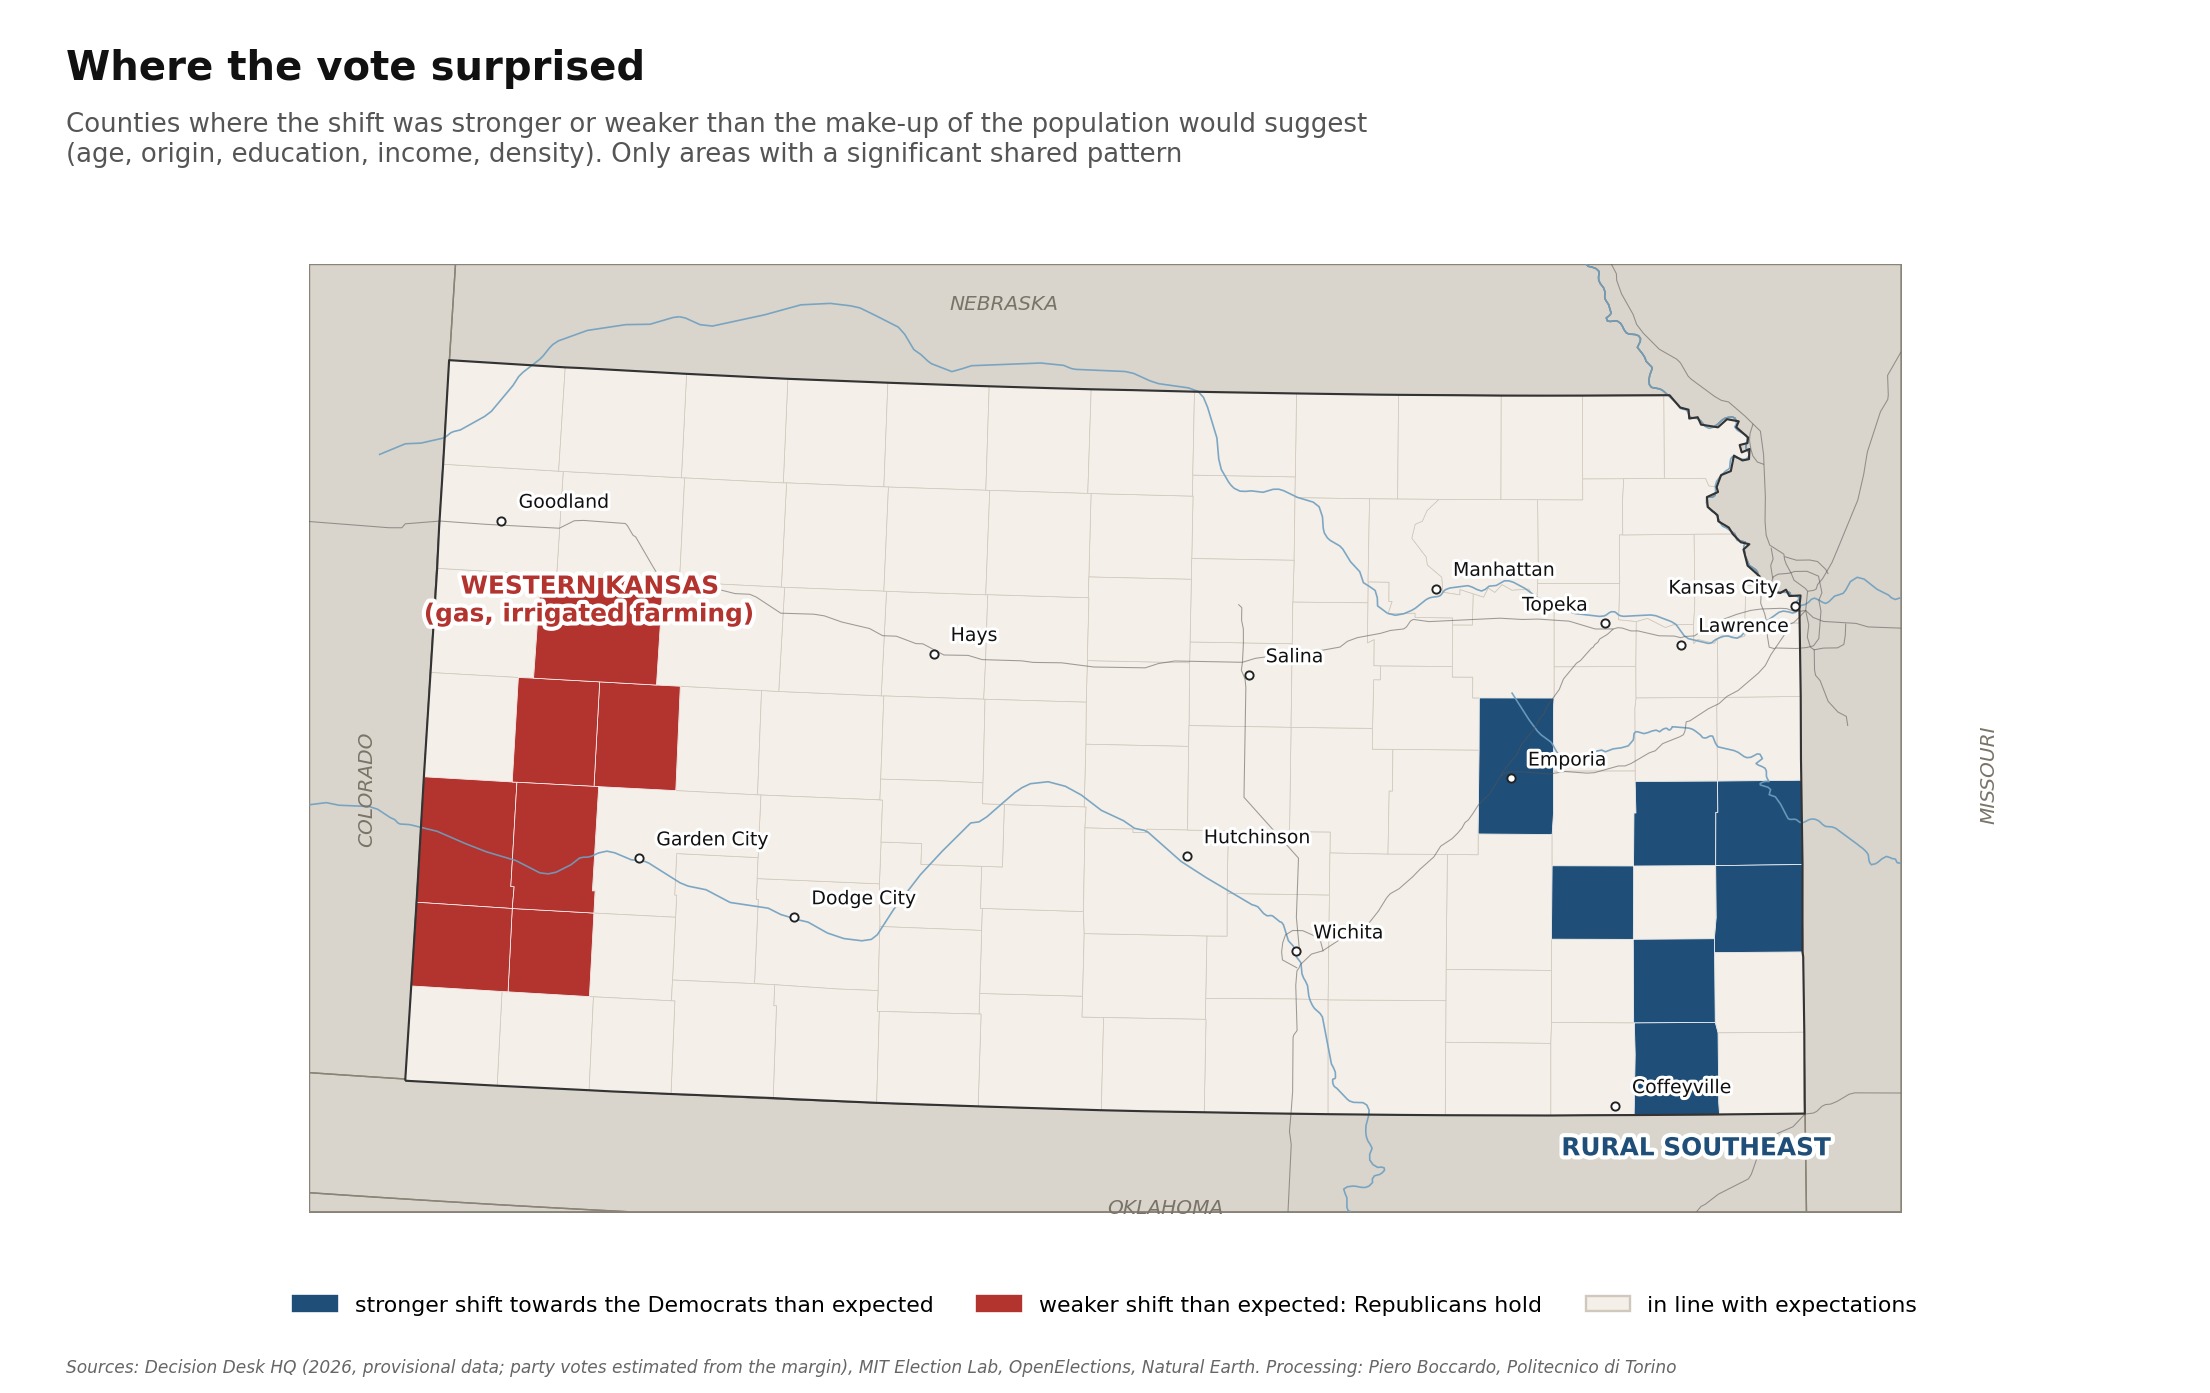 Figure 9. Kansas, areas where the shift was stronger (blue) or weaker (red) than the make-up of the population predicts. Source: author’s processing of Decision Desk HQ and MIT Election Lab data.
What remains to be understood
The map of the two states suggests a lead that national commentary is not following: energy areas, from the Permian Basin to western Kansas, are the only places where the Republican vote held up better than expected. To say so with more confidence we need production and employment data by county, and we will need to separate the weight of oil from that of agriculture, which coexist in those areas. That is the next step, together with extending the analysis to the other states where the Senate seat changed colour.
A note on methodology
The 2026 results are provisional. For Texas I used the county data of the Texas Secretary of State; for La Salle County, missing from the intermediate source, the votes were derived as the difference from the state total. For Kansas I used the margin and the number of voters by county published by Decision Desk HQ, and estimated the two parties’ votes assuming the same Libertarian candidate share everywhere (3%): the reconstructed totals differ from the unofficial ones by fewer than one hundred votes out of 1.1 million.
The historical comparisons use the 2016, 2020 and 2024 presidential results by county, the 2018 Senate and 2022 governor races for Texas, and the 2022 Senate race for Kansas (MIT Election Lab and OpenElections). In the 2018 OpenElections file the rows for El Paso and Ellis were swapped and have been corrected. Margins are calculated on the two-party vote only.
The “expected” shift comes from a regression weighted by number of voters on the share of Hispanics and foreign-born residents, whites without a college degree, people over 65, median income, density, distance from the large cities and the 2024 margin (MIT Election Lab context data, American Community Survey 2012-2016). The areas highlighted in figures 6 and 9 are the significant clusters (p < 0.05) of the local Moran index on the residuals. This is an ecological analysis: it describes counties, not the behaviour of individual voters.
Sources: Texas Secretary of State, results of 3 November 2026 (via txelectionresults.com); Decision Desk HQ, Kansas Senate results; MIT Election Data and Science Lab; OpenElections; T. McGovern, US County Level Election Results 2008-2024; FEMA, OpenFEMA, declaration DR-4879; Natural Earth. Map and statistical processing by Piero Boccardo, Politecnico di Torino.