Ust-Luga, the parking lot for Russia's shadow fleet
A satellite analysis and a cross-check of public AIS data paint a more nuanced, but no less troubling, picture of the tanker queue reported by the international press
by Piero Boccardo
At the gateway to the Gulf of Finland, a few dozen kilometers from Russia’s Ust-Luga oil terminal, a handful of satellite images and a few vessel-tracking screenshots tell a story that headlines about the “monster queue” of Russia’s shadow fleet don’t fully capture: not so much a sudden emergency as a now-structural bottleneck, made up of ships sitting still for weeks, flags that keep changing, and an opacity that can partly be checked with public tools.
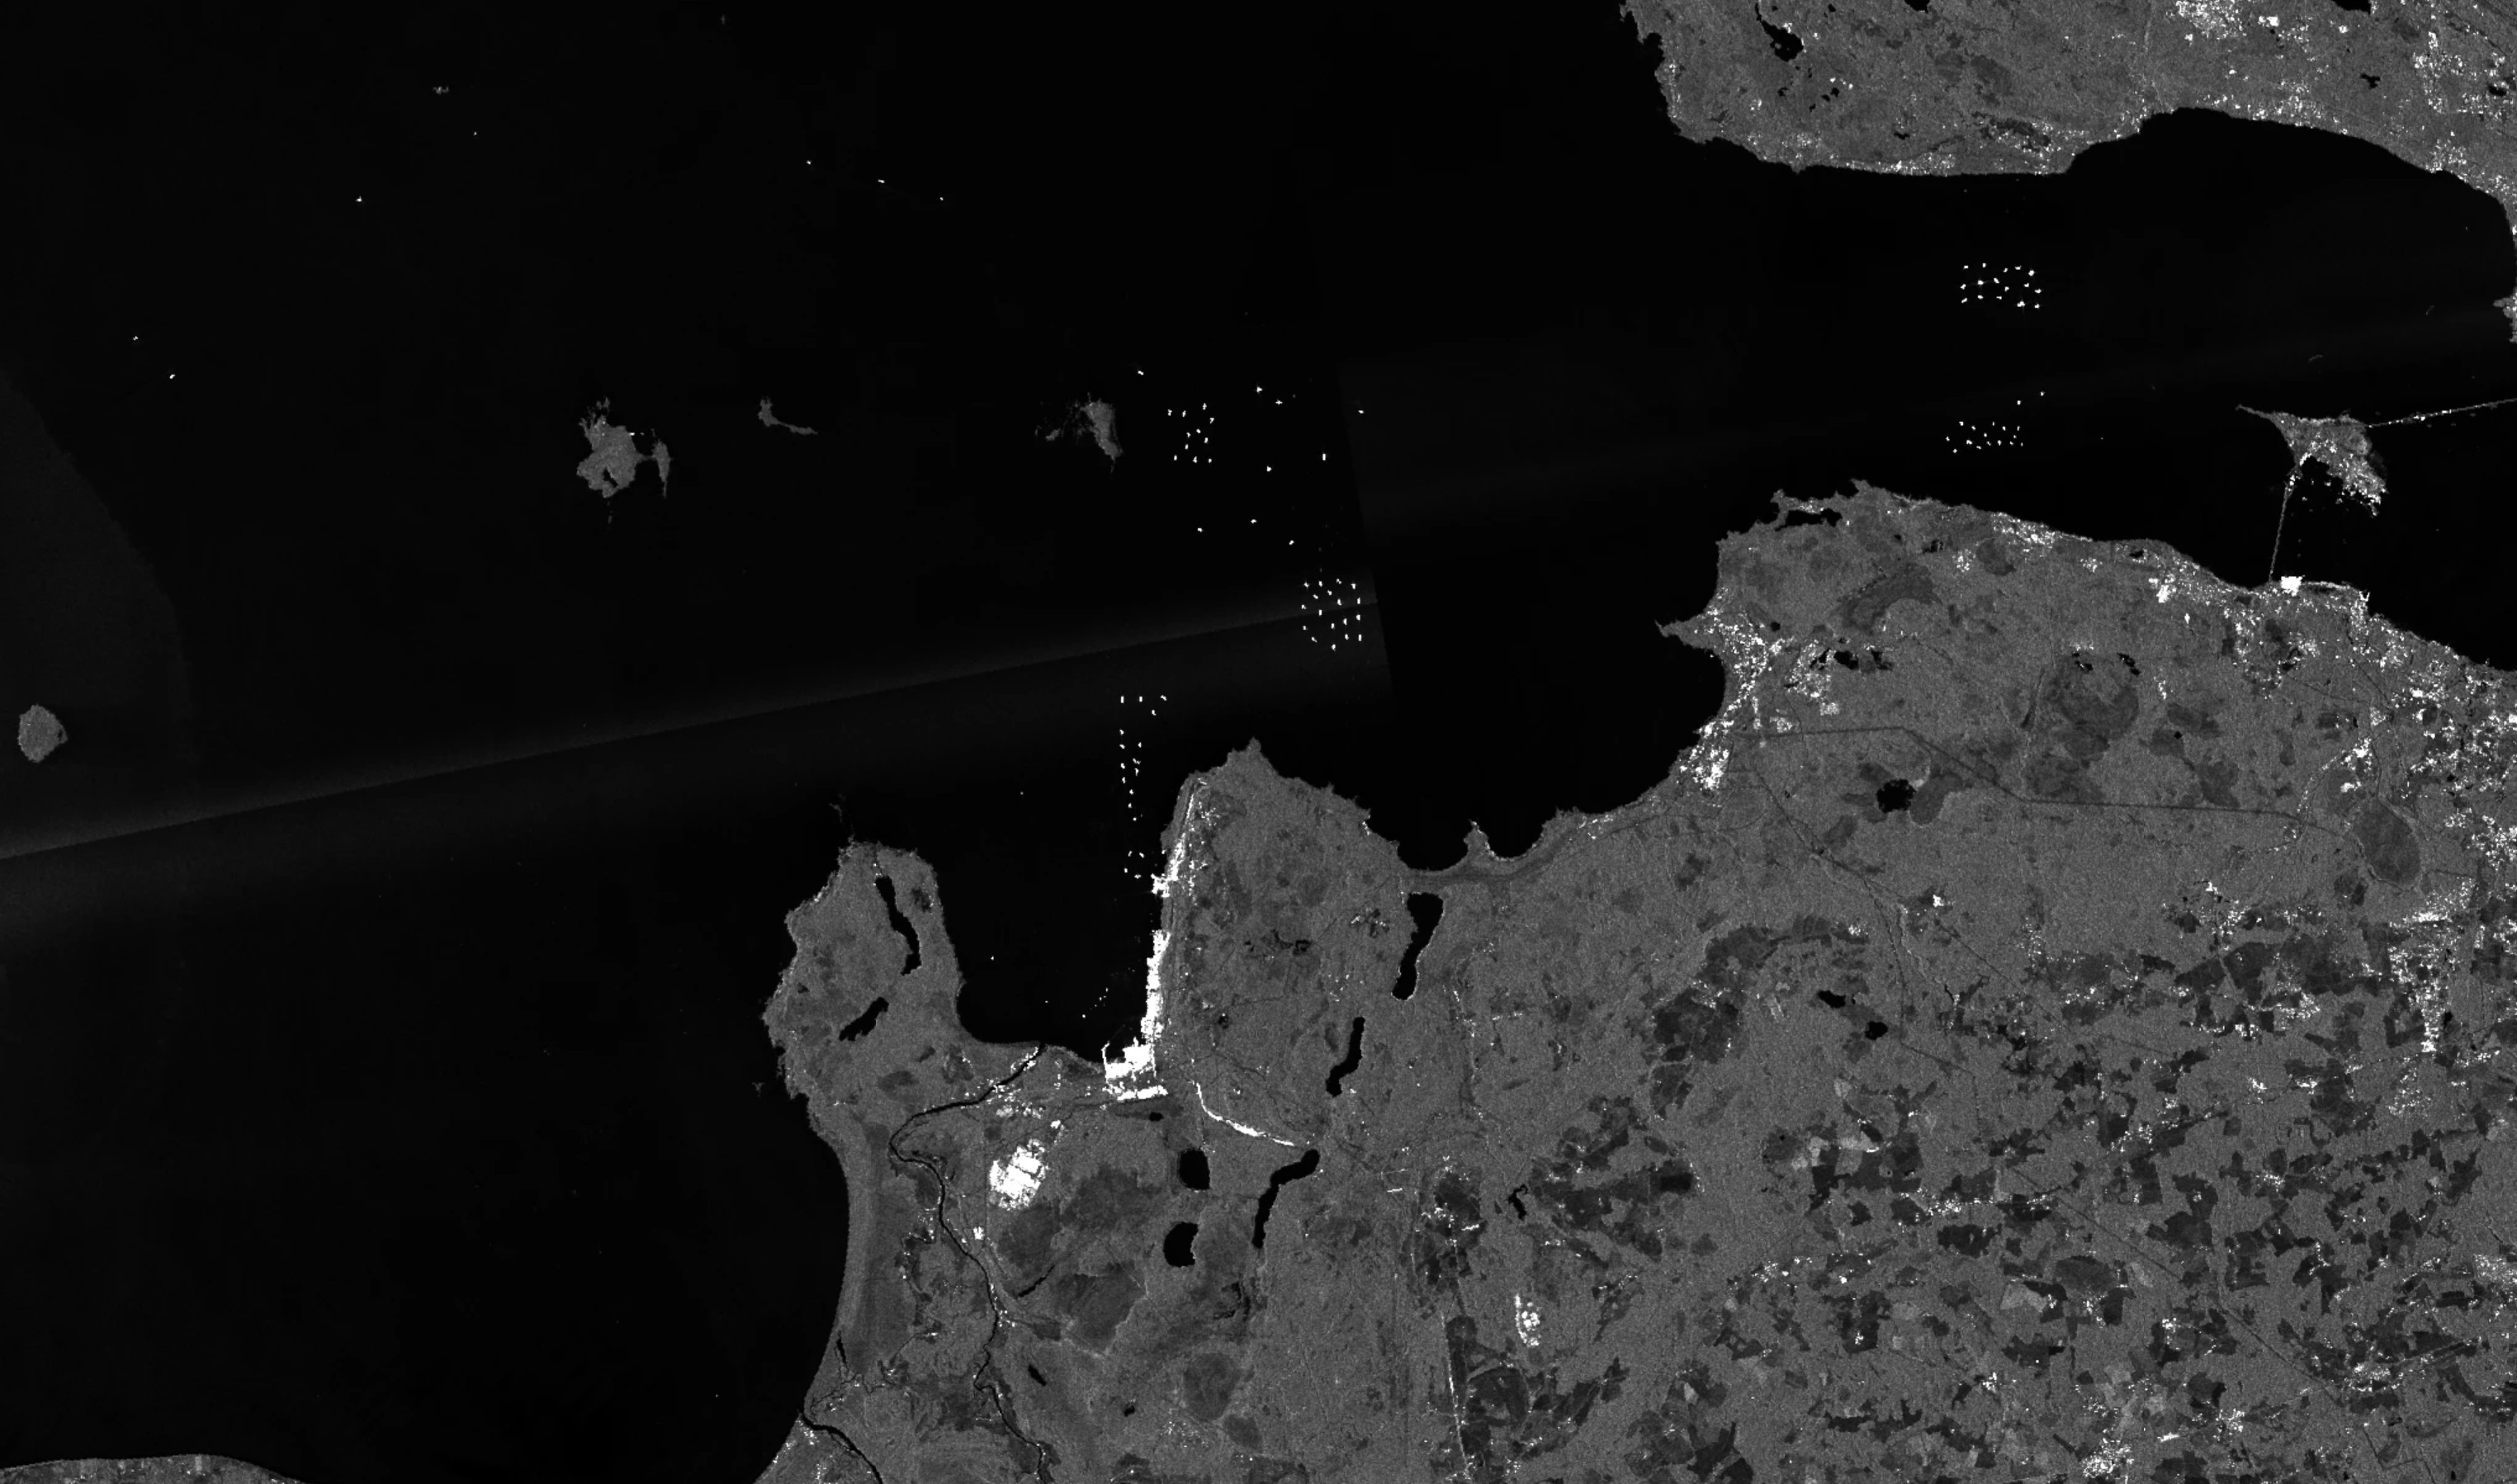
Copernicus Sentinel-1 (SAR), entrance to the Gulf of Finland near Ust-Luga, October 3, 2026. The bright targets on the water are radar returns from anchored ships; the white block at the bottom is the Ust-Luga port terminal. Credit: Copernicus Sentinel-1, processed by the author.
A chronic bottleneck, not a sudden emergency
Since mid-August 2026, the international press, drawing on commercial imagery from Starboard Maritime Intelligence and analysis by the open-source researcher known as Russian Forces Spotter, has reported a rapidly growing queue. On August 16 fewer than ten ships were waiting; by September 16 that had already doubled to about 24; by September 30 the number had risen to about 150 (65 tankers and 85 cargo ships), and by October 2 to about 200, of which 111 were tankers and 83 cargo vessels. The main line, nearly 60 kilometers long, is concentrated at the mouth of the gulf, but a more scattered group of 43 ships sits as far as 120 kilometers from the Ust-Luga terminal, with waiting times reaching five days before entering port (The Insider, October 2, 2026). The cause cited by most outlets is well known: Ukrainian drone attacks on Russian shipping in the Black Sea pushed Moscow, from mid-August onward, to divert part of its traffic to Baltic ports, creating the bottleneck (Reuters, August 2026).
A direct comparison between the October 3 Sentinel-1 acquisition and images of the same area from August and from the same period the previous year, carried out by this author, shows surprisingly stable numbers for the targets visible in this specific frame. Rather than a sudden spike, what emerges is a chronic phenomenon: a semi-permanent anchorage that has existed for some time and that the Black Sea crisis has likely swelled elsewhere, over stretches of sea wider than the one photographed here.
Crossed flags: four tankers, four profiles
Public vessel-tracking data (AIS, via MarineTraffic) gives these radar targets faces and names: on October 5 it captured a small, mixed sample of the Ust-Luga anchorage. The four profiles that follow, compared side by side, illustrate the double, or rather quadruple, nature of this fleet: ships now flying the Russian flag, ships still sailing under flags of convenience, and vessels belonging to Russia’s older, riskier merchant fleet.
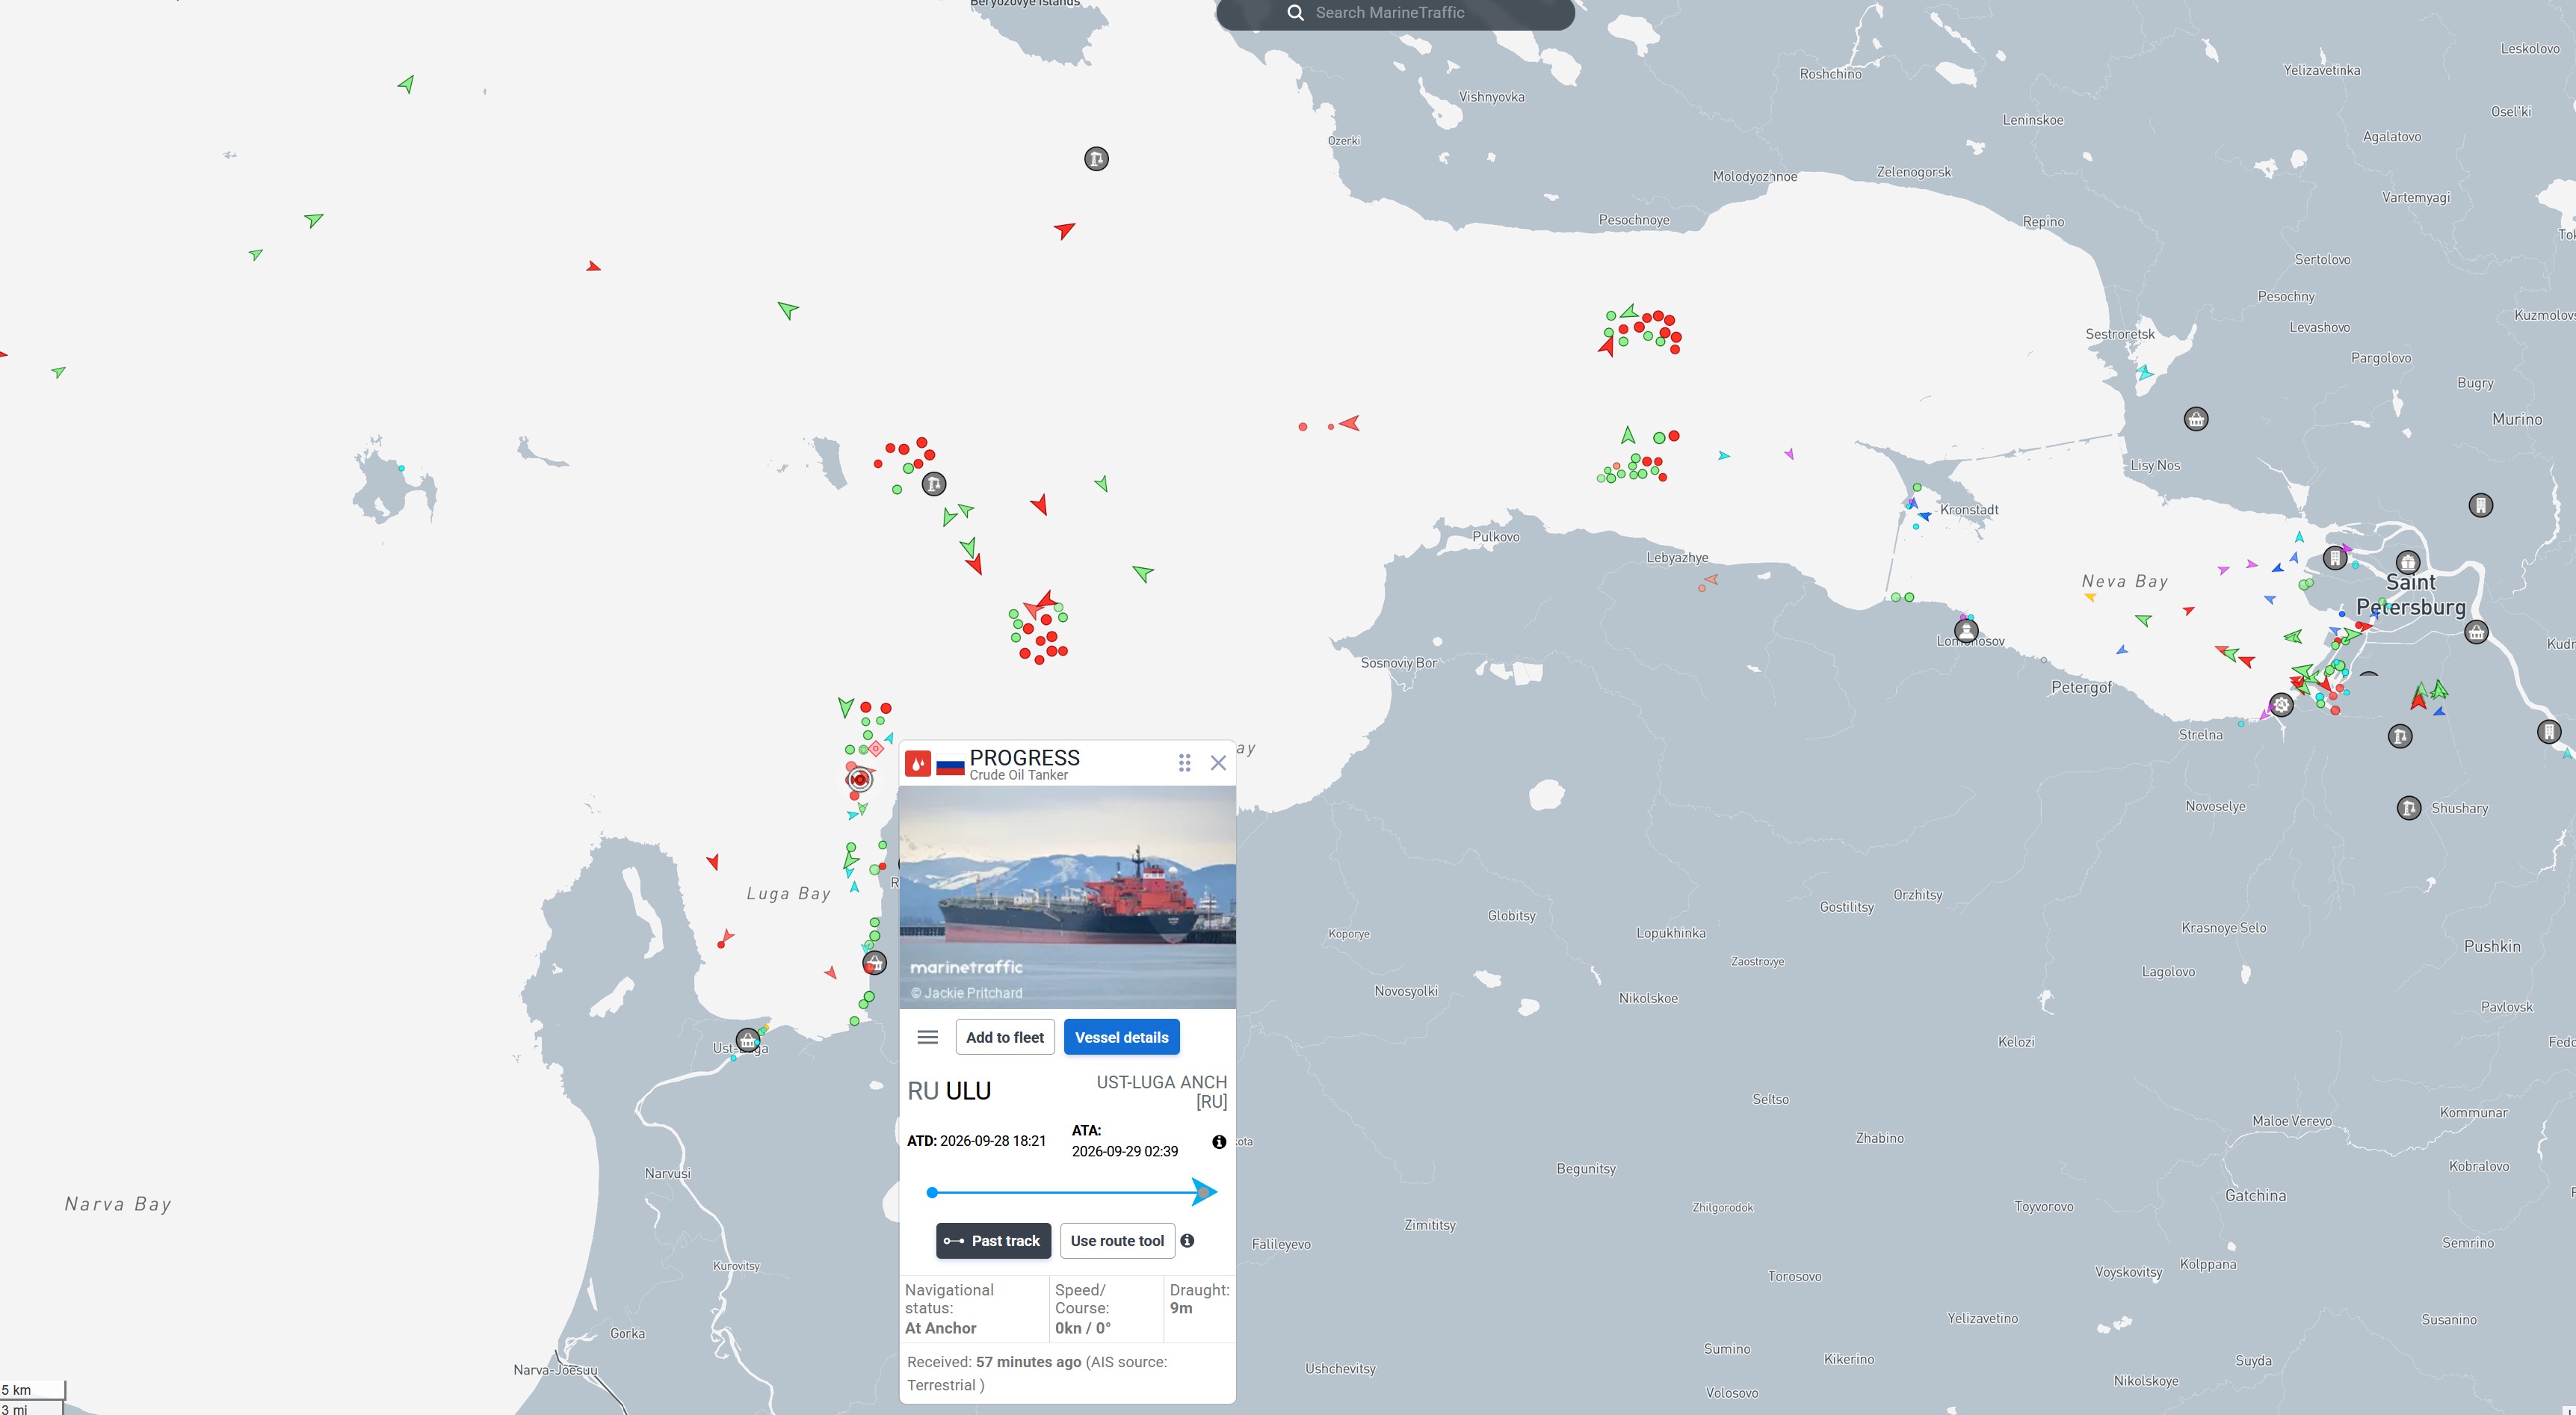
Progress, Russian flag. Crude oil tanker, at anchor since September 29: over a week of waiting. Credit: MarineTraffic.
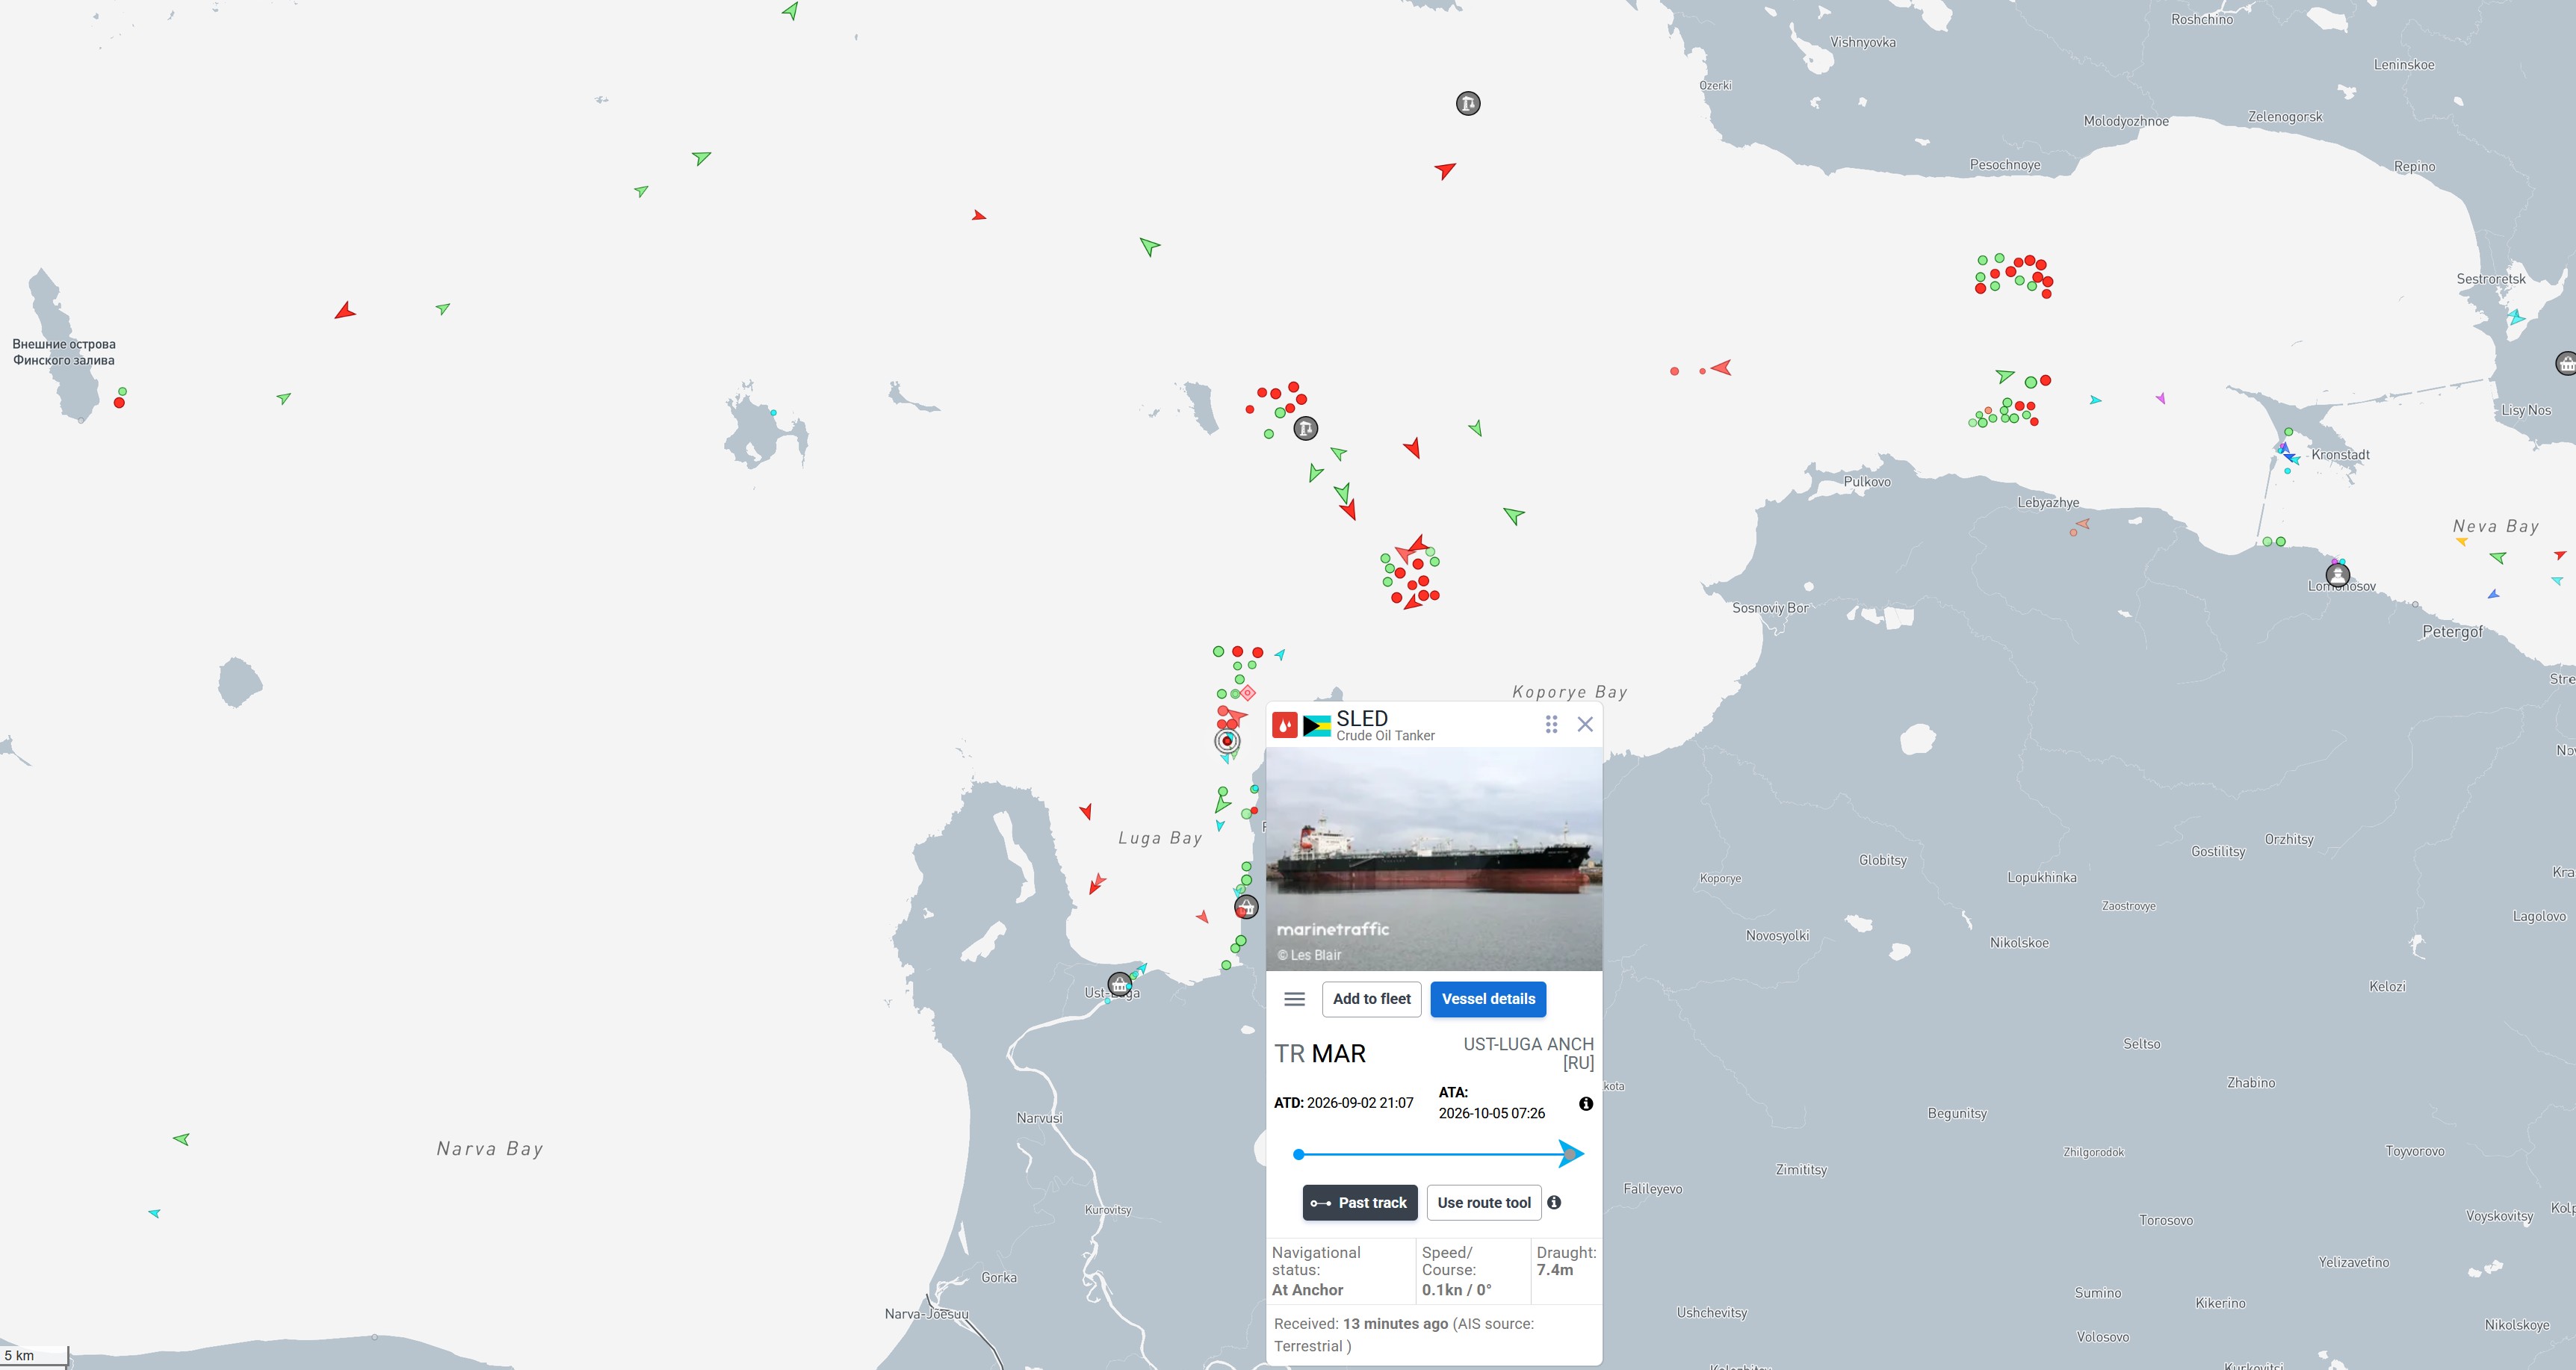
Sled, Bahamas flag. Crude oil tanker, at anchor since September 2: over a month of waiting. Credit: MarineTraffic.
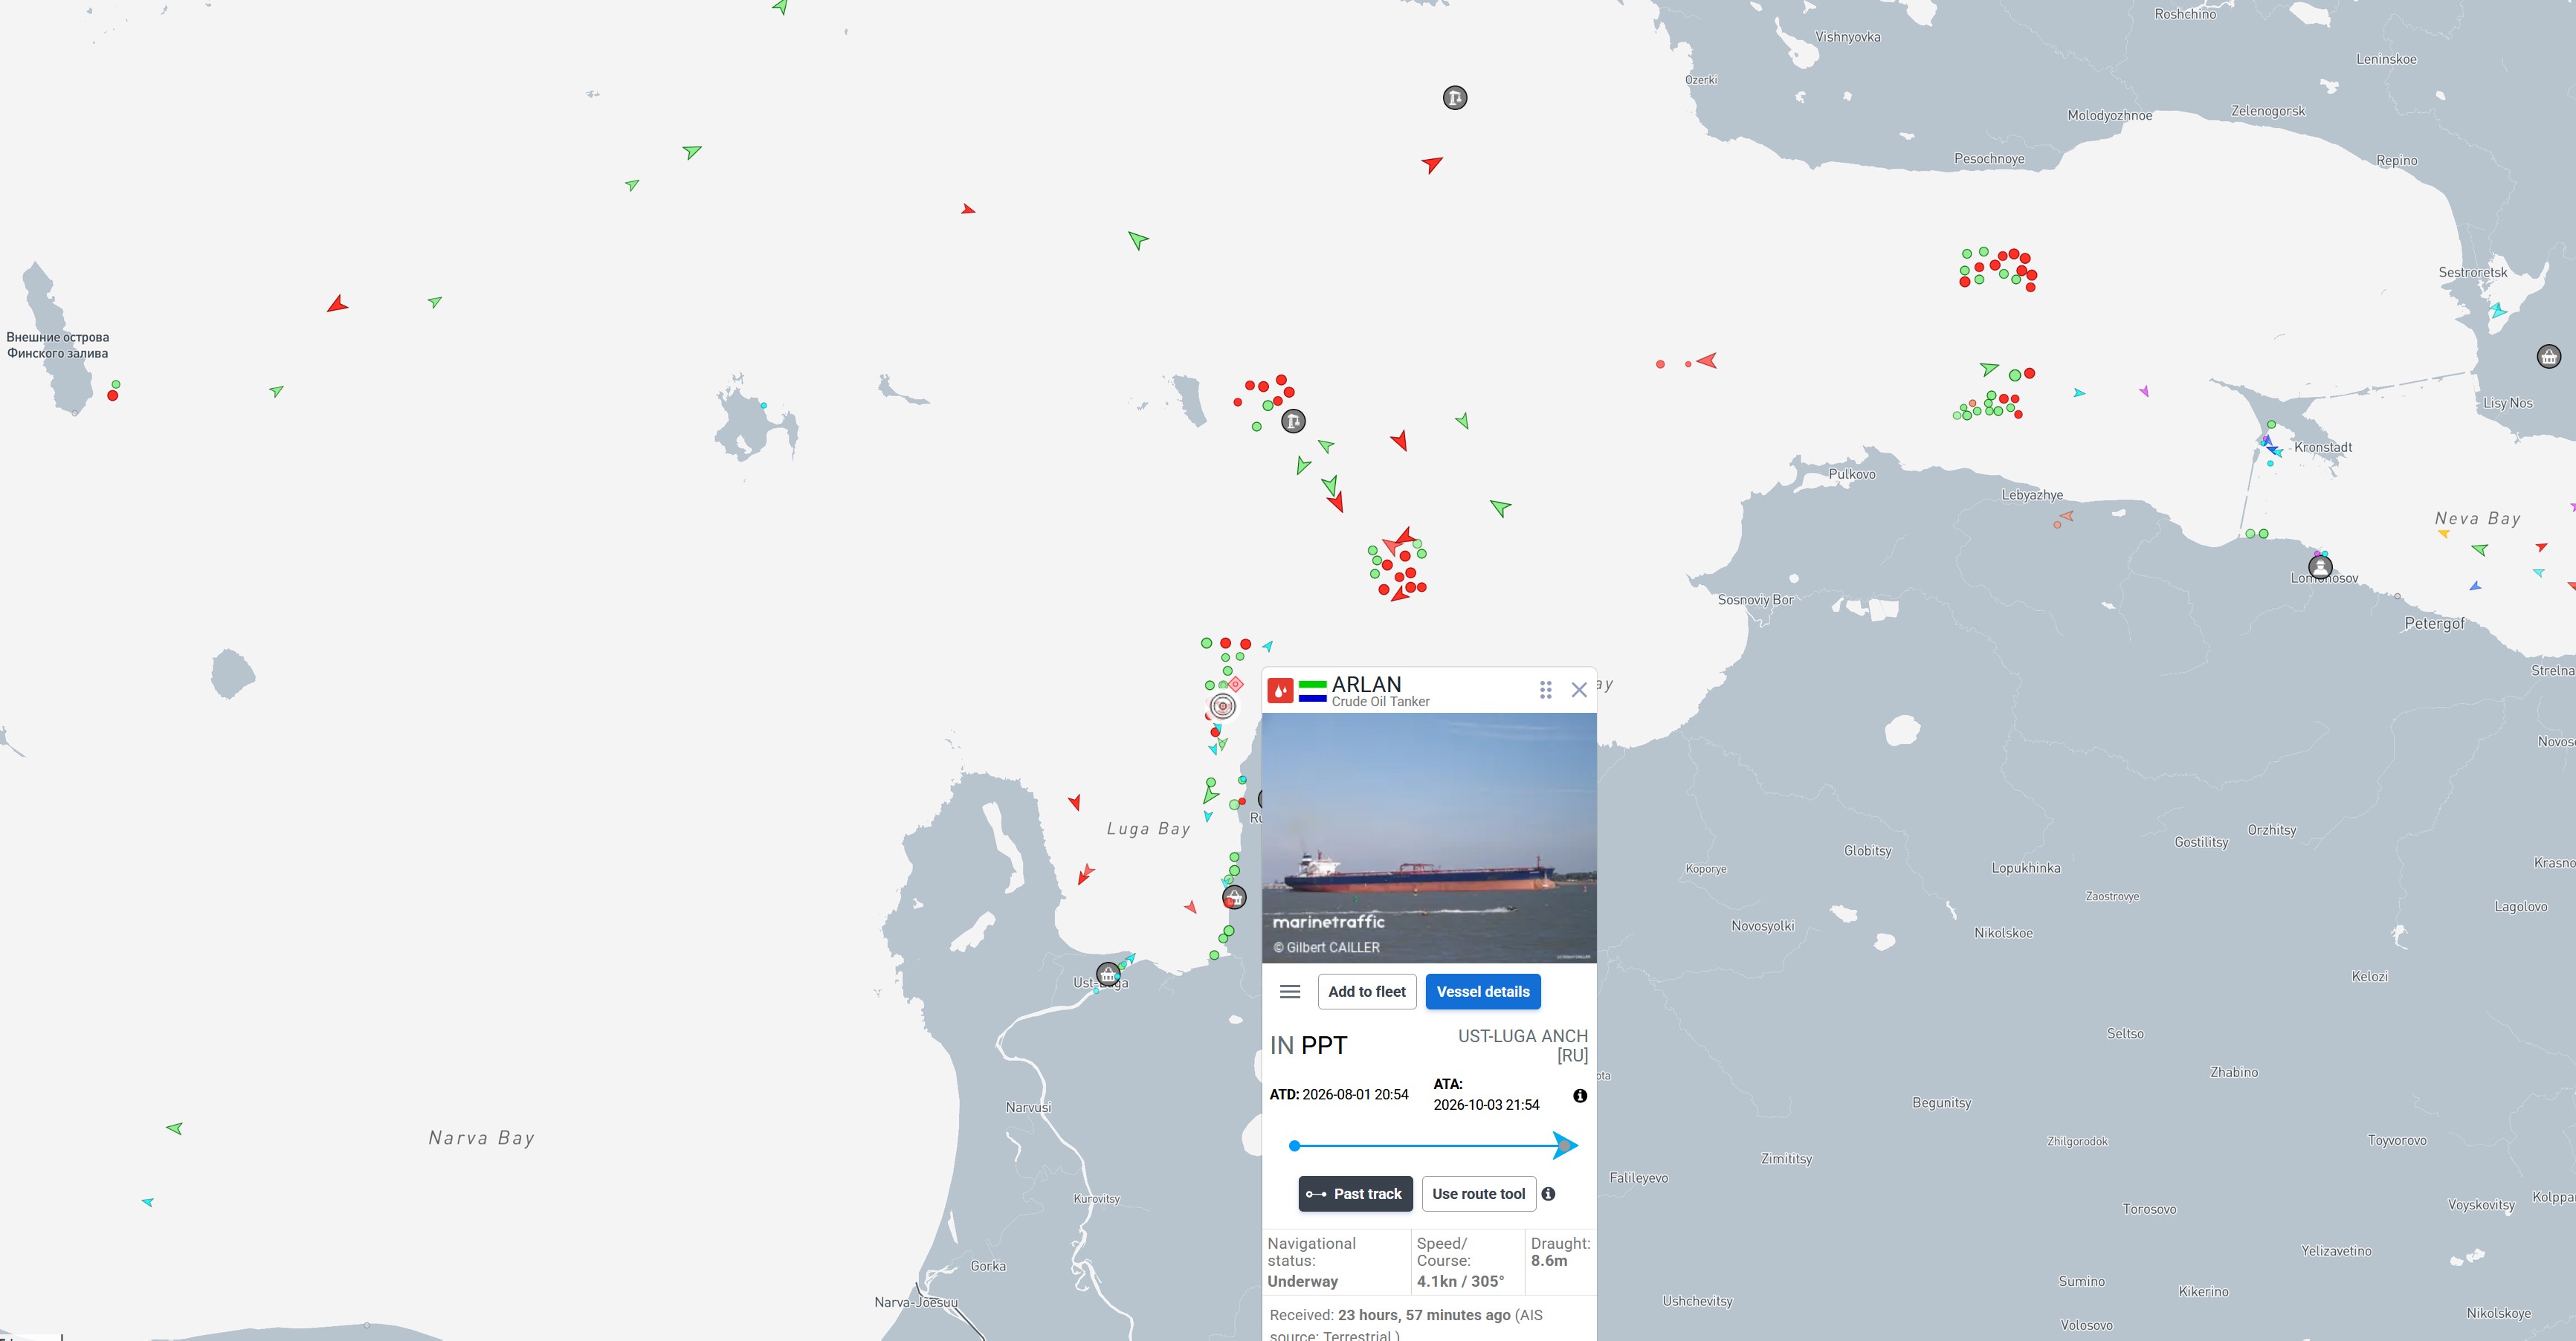
Arlan, Sierra Leone flag. Sailing slowly (4.1 knots), with roughly a two-month gap between its last port of call (August 1) and its expected arrival (October 3). Credit: MarineTraffic.
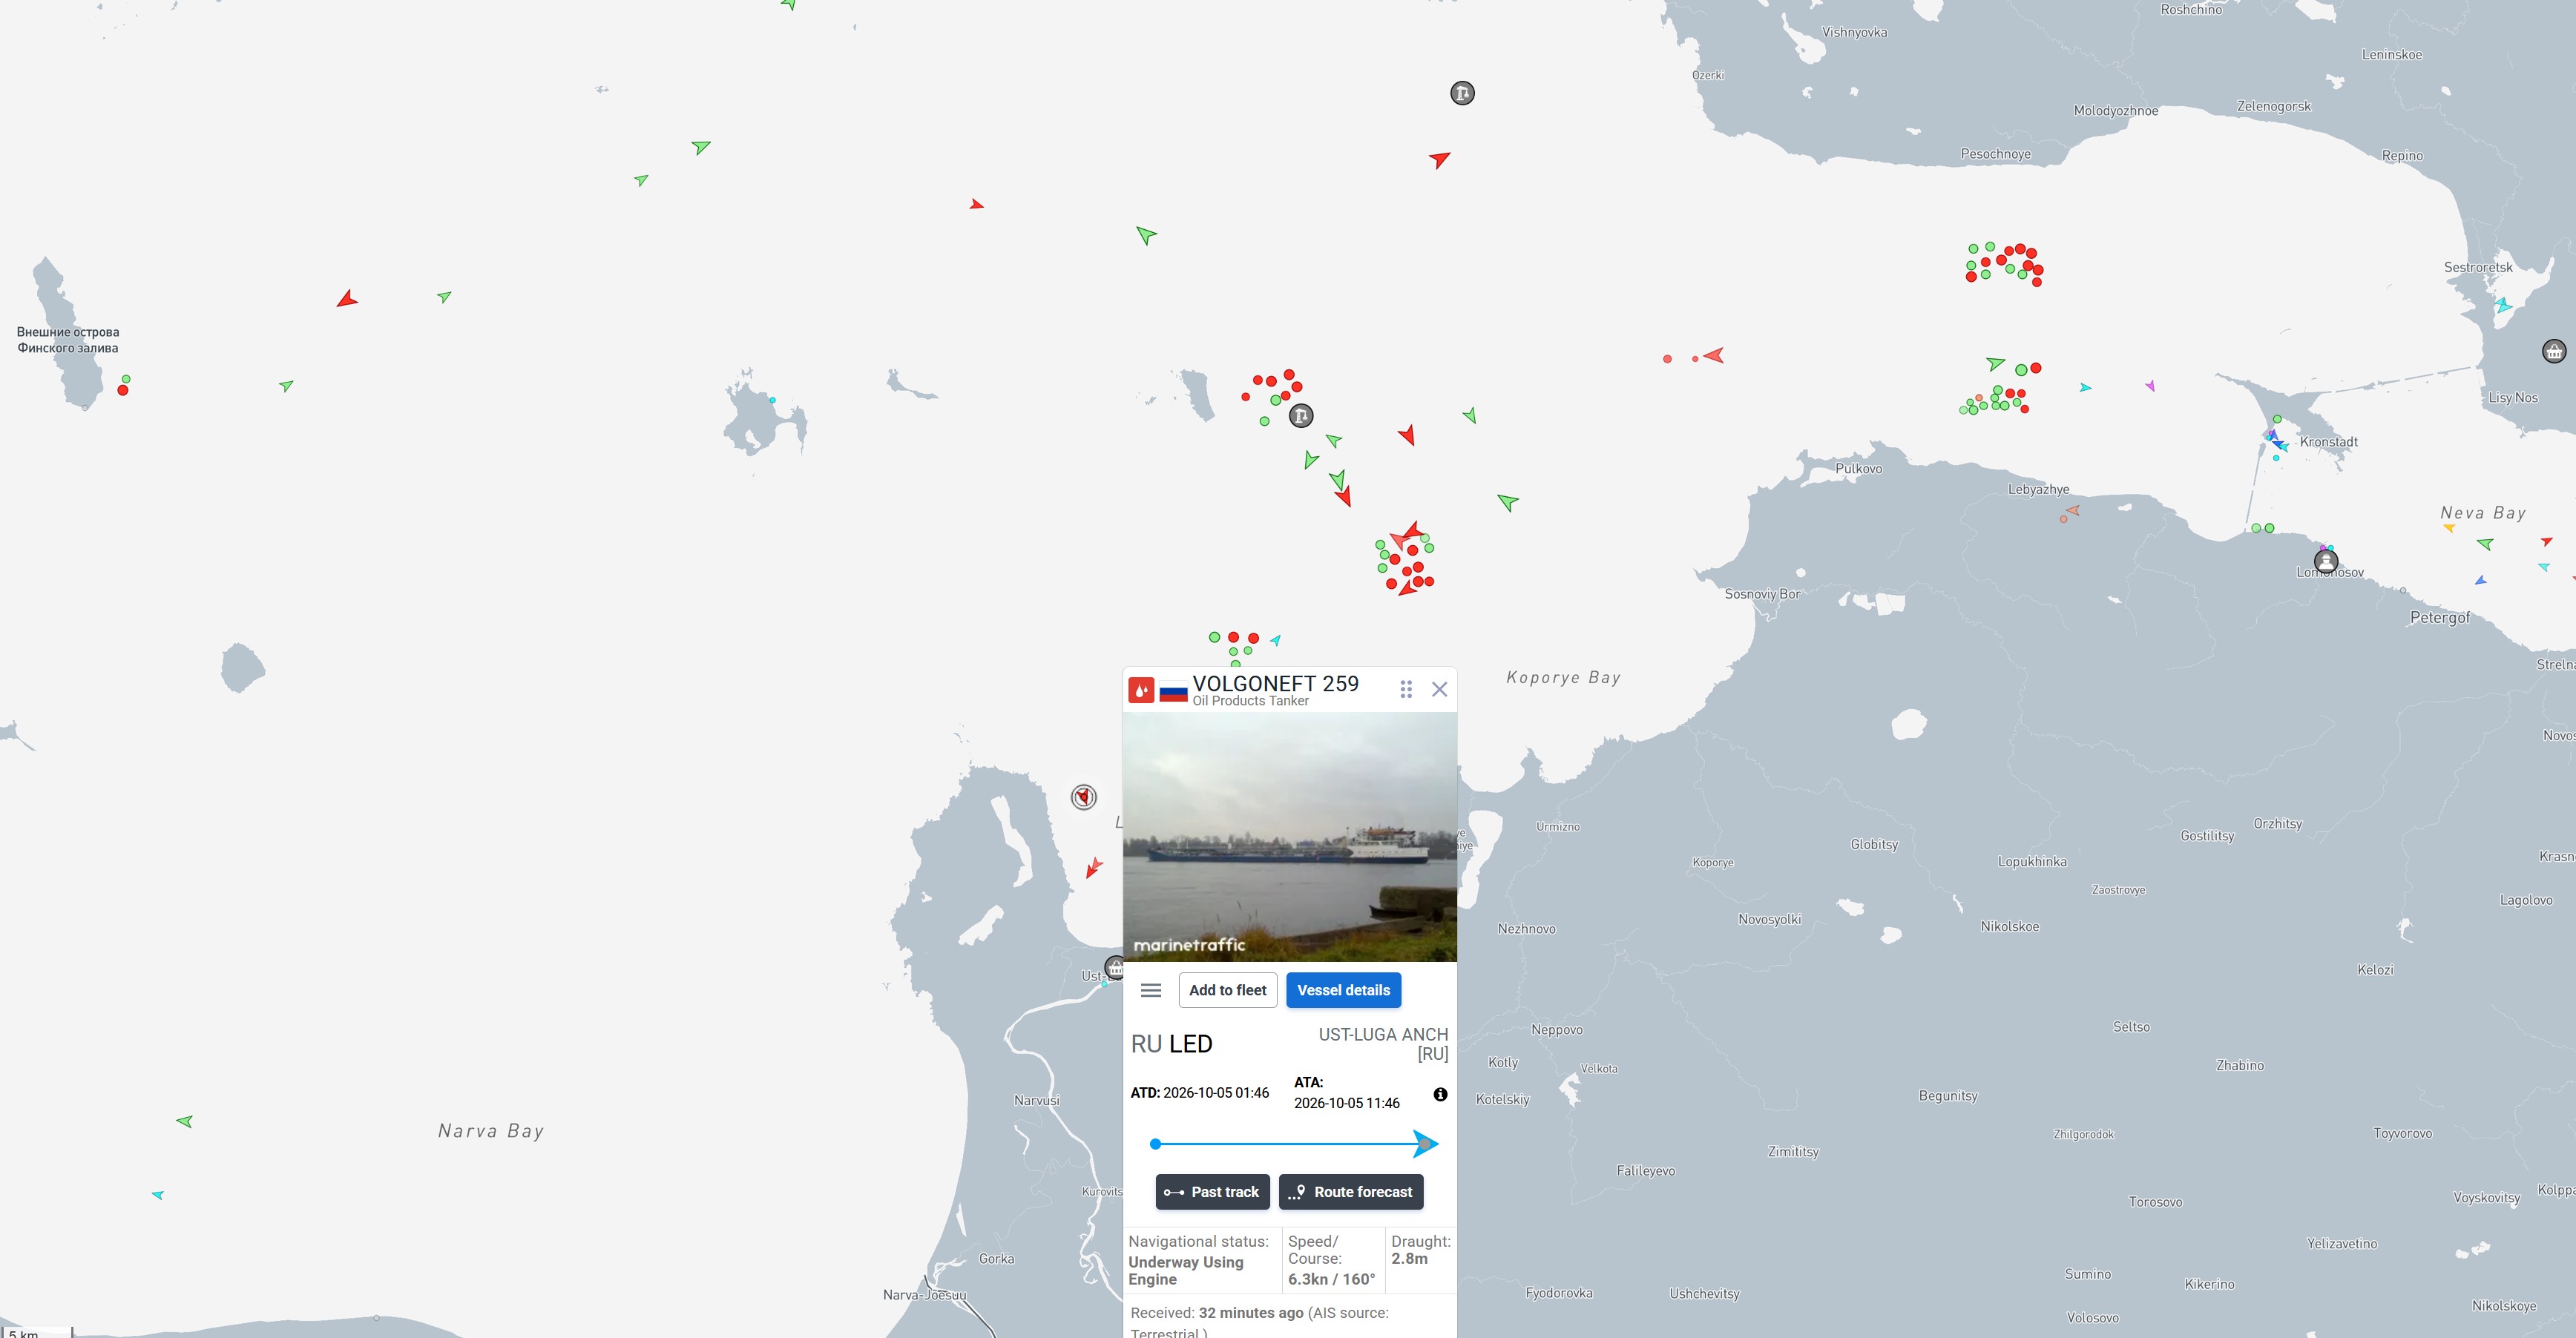
Volgoneft 259, Russian flag. River-sea tanker for oil products, shallow draught (2.8 meters): a class already involved in environmental incidents in the Black Sea. Credit: MarineTraffic.
The most useful detail is precisely this heterogeneity: a ship already re-flagged under the Russian registry (Progress), one still under a flag of convenience (Sled, Bahamas), a third under yet another flag (Arlan, Sierra Leone) with a long and opaque voyage profile, and a Russian Volgoneft-class unit, a class of aging river-sea tankers already responsible in the past for spills in the Black Sea. Together, the four profiles are worth more than any single aggregate figure: they show how the Ust-Luga anchorage today is a crossroads of different flags, very uneven waiting times and, in at least one case, inherently riskier shipping.
The context: Black Sea, severed cables, sanctions
This microcosm has to be read within a wider frame, already known but given concrete visual confirmation here: hundreds of tankers switching to the Russian flag registry to dodge Western controls; undersea telecommunications and energy cables severed in the Baltic in recent years, with recurring suspicion falling on the shadow fleet; and a price cap on Russian oil that this very fleet largely exists to get around. The Baltic, in other words, is becoming a semi-permanent back room for the murkier part of Russia’s merchant marine, with environmental consequences that are far from trivial given the average age and insurance status of many of these vessels.
More than a single emergency to photograph and forget, what public satellites and AIS data show together is a structural condition. That, more than whether the queue is growing or not, may be the real reason to keep watching it from above.
A note on methodology
The opening radar image is a Copernicus Sentinel-1 (SAR) acquisition from October 3, 2026, chosen because radar signal doesn’t depend on cloud cover and still returns sharp, point-like bright targets for anchored ships. The comparison with earlier acquisitions of the same area, from August 2026 and from the same period in 2025, was run on the same geographic frame to check whether the number of targets had genuinely grown over time or was already stable: the result, surprisingly constant numbers, underpins the “chronic bottleneck” reading proposed in this piece, which partly contrasts with the rapid-growth narrative in the international press based on other sources (Starboard Maritime Intelligence commercial imagery, Russian Forces Spotter analysis) that, however, refer to a wider area than the one photographed here.
The four vessel-tracking profiles come from public AIS data collected via MarineTraffic on October 5, 2026. AIS data has known limits: ships can switch off their transponder, and parameters such as estimated time of arrival (ETA) are calculated by the platform and don’t always match actual arrival. For this reason the four ship profiles should be read as single-day snapshots, not as independently verified voyage records.
Sources: Copernicus Sentinel-1 (SAR) satellite image, acquired October 3, 2026, processed by the author; vessel-tracking (AIS) data from MarineTraffic, recorded October 5, 2026; queue chronology and figures from The Insider (Starboard Maritime Intelligence), Reuters, Moscow Times, Il Gazzettino. Cartographic and statistical elaboration by Piero Boccardo, Politecnico di Torino. Published on Linkiesta, October 8, 2026.